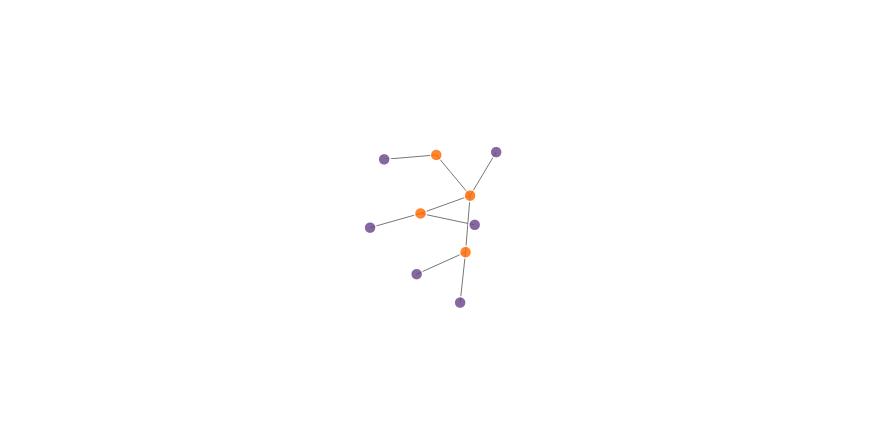
Here's how to control colour of nodes with forceNetwork. Notice this still won't tell you the direction of the links because some nodes are source for some links and target for others - so you'll need to rethink that logic somehow. But anyway, here's controlling colour of nodes.
# Load package
library(networkD3)
library(dplyr) # to make the joins easier

# Create fake data
src <- c("A", "A", "A", "A",
         "B", "B", "C", "C", "D")
target <- c("B", "C", "D", "J",
            "E", "F", "G", "H", "I")
networkData <- data.frame(src, target, stringsAsFactors = FALSE)

nodes <- data.frame(name = unique(c(src, target)), stringsAsFactors = FALSE)
nodes$id <- 0:(nrow(nodes) - 1)


# create a data frame of the edges that uses id 0:9 instead of their names
edges <- networkData %>%
   left_join(nodes, by = c("src" = "name")) %>%
   select(-src) %>%
   rename(source = id) %>%
   left_join(nodes, by = c("target" = "name")) %>%
   select(-target) %>%
   rename(target = id)

edges$width <- 1

# make a grouping variable that will match to colours
nodes$group <- ifelse(nodes$name %in% src, "lions", "tigers")

# simple with default colours
forceNetwork(Links = edges, Nodes = nodes,
             Source = "source",
             Target = "target",
             NodeID ="name",
             Group = "group",
             Value = "width",
             opacity = 0.9,
             zoom = TRUE)

# control colours with a JS ordinal scale
# edited 20 May 2017 with updated code from Renal Chesak's answer:
ColourScale <- 'd3.scaleOrdinal()
            .domain(["lions", "tigers"])
           .range(["#FF6900", "#694489"]);'

forceNetwork(Links = edges, Nodes = nodes,
             Source = "source",
             Target = "target",
             NodeID ="name",
             Group = "group",
             Value = "width",
             opacity = 0.9,
             zoom = TRUE,
             colourScale = JS(ColourScale))
![enter image description here]()


forceNetwork(), in the same package? you can control colour through Group, and a JavaScript scale. I can do a full answer if you're keen. – Meyeroff