How to extract data from figure in matlab?
Asked Answered
K

1

5

I have saved different Matlab plots in an unique .fig. The figure is like this: picture Now, I would like to introduce a filter in these plots to reduce the noises, but unfortunately I have lost the code that generates these signals.
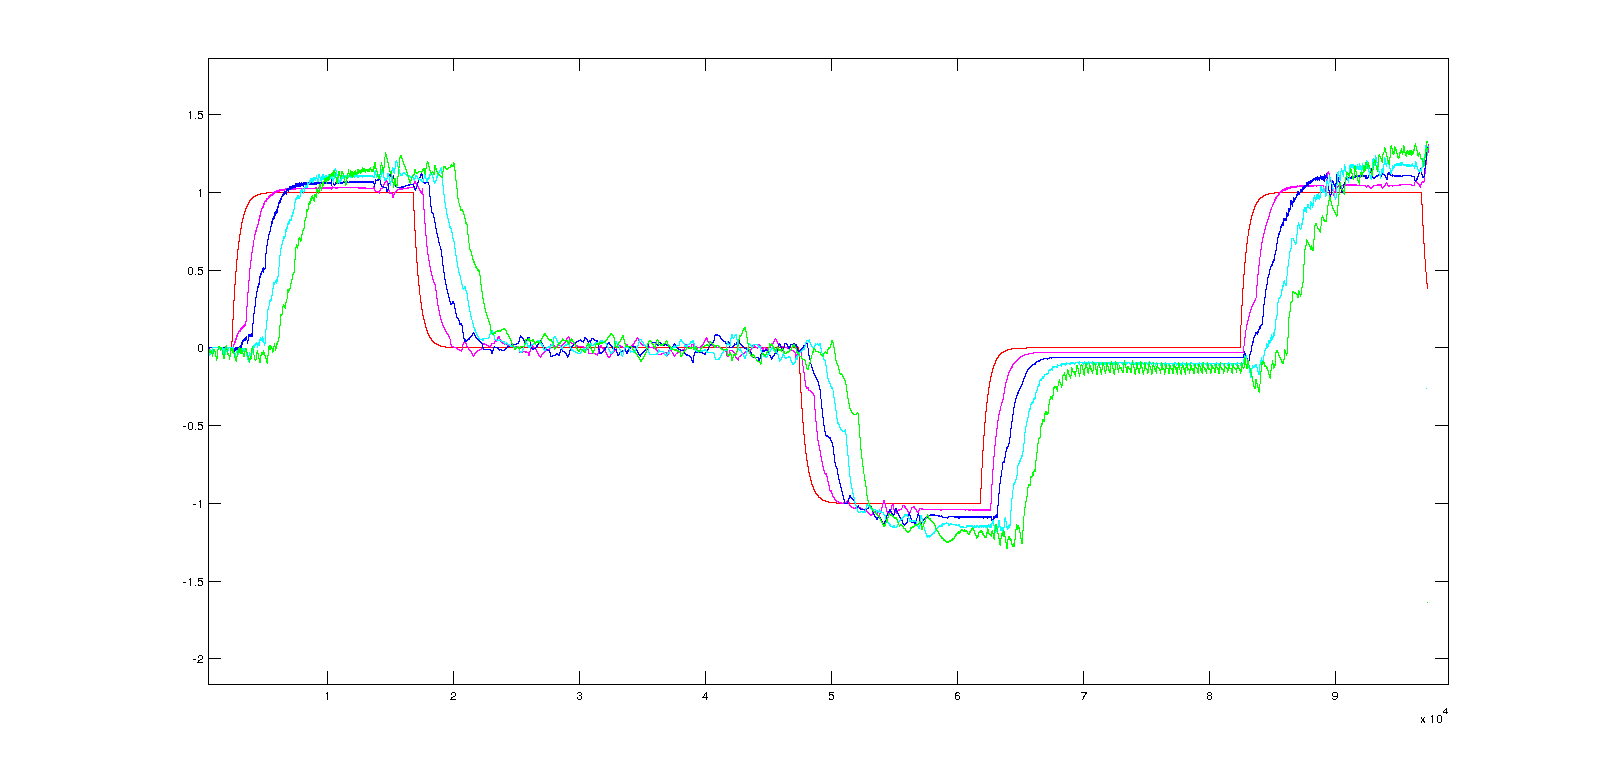
Is there a way to extract data of each signal in this figure? I tried this:

open('ttc_delay1000.fig'); 
h = gcf; %current figure handle
axesObjs = get(h, 'Children');  %axes handles
dataObjs = get(axesObjs, 'Children'); %handles to low-level graphics objects in axes

objTypes = get(dataObjs, 'Type');  %type of low-level graphics object

xdata = get(dataObjs, 'XData');  %data from low-level grahics objects
ydata = get(dataObjs, 'YData');

But I am confused and I don't know if it's the right way to act. Thanks!

Kinsfolk answered 26/11, 2015 at 9:16 Comment(10)
Well, what does your code produce?Cambium
I have Objtypes and xdata, ydata, structures composed by a 5x1 cell. Each row of these structures contains the data of each signal, i guess. Is that right?Kinsfolk
It would seem so:) Try reproducing your plot on a new figure, based on those data. That's a sure way of knowing for sure. Note that handles are usually stored in vectors in a reverse order: stuff plotted last usually pop to the front of the list.Cambium
yes, this code should do the job; but remember that you've lost your function and only have finite number of samples of your data, so you want to be smart about how you want to filter/reduce noise.Ectomere
indeed it works writing plot(xdata{1,1}, ydata{1,1}) and so on. Yes, now I have to understand how to filter these signal. But I think it 's possible..Kinsfolk
I guess the answer that I posted is not what you wanted... could you be more specific on what is the expected output? And update the question accordingly, while we're at it?Kalidasa
Actually yes, my code works and also yours, that is way more compact. Maybe it's better to update the question :)Kinsfolk
A brutal way to filter your high frequency noise (I call it the chuck Norris) is : 1/ run an fft on your signal - 2/ set to 0 all coefficients corresponding to high frequencies 3/ run ifft on the result to get filtered signal. Mathematicians or non Chuck Norris fans would strongly recommend using a Gaussian low pass filter after the fft stepRooster
@Kinsfolk I've added code to smooth out the lineseriesKalidasa
Your original question about getting the data from the figures has been answered; asking about the filtering is an entirely different issue. Please open another question for that.Biliary
K
7

A one-liner for your problem:

data = get(findobj(open('ttc_delay1000.fig'), 'Type','line'), {'XData','YData'});

The steps are there (from the inner calls to the outer calls):

  • open the file;
  • look into it for the line series;
  • return the data.

data{n,1} will contain the XData of the LineSeries number n, wile the data{n,2} will contain the YData of the said LineSeries.

If you want to smooth the lines directly in the figure, the idea is the same:

    %//Prepare moving average filter of size N
    N = 5;
    f = @(x) filter(ones(1,N)/N, 1, x);

    %//Smooth out the Y data of the LineSeries
    hf = open('ttc_delay1000.fig');
    for hl = transpose(findobj(hf,'Type','line'))
            set(hl, 'YData', f(get(hl,'YData')));
    end;
    saveas(hf, 'ttc_delay1000_smooth.fig');
Kalidasa answered 26/11, 2015 at 9:35 Comment(2)
Wait, findobj works for grandchildren? What have I been doing all these years!Rooster
@Rooster When the first argument is a graphic handle (or an array of), the search is restricted to those handles and their descendants indeed.Kalidasa

© 2022 - 2024 — McMap. All rights reserved.