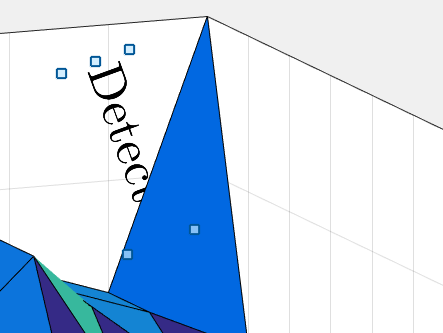
I have a figure in MATLAB. Then I add a text to it by typing,
b = text(0.5, 0.5, 'Detector action', 'Rotation', -70, 'FontSize', 25);
But the text goes behind the figure (See below),

I also tried,
uistack(b, 'top');
but it didn't work.
The easiest way is not to bother with a text at all, but instead use an annotation, since such an object will be (at least by default) above the axes (and thus, anything plotted inside them).
The trick with annotation objects, is that counter-intuitively, we need not use a TextBox, but instead a TextArrow, while making the arrow itself invisible.
For example:
figure(); membrane();
annotation('TextArrow', [.5 .5], [.5 .5], 'String','Some text', 'TextRotation', -30, ...
           'HeadStyle','none','TextBackgroundColor','w' );
© 2022 - 2024 — McMap. All rights reserved.
annotation? – Baptismtextobject in a 3D domain, so depending on your viewpoint there is always a case where it will be behind the graph. Just find the coordinate set(x,y,z)which place your text in front of the graph in the final view – Angelicaangelicotextobject is placed in the same 3D domain as the data you plot, so the relative position of your patch and your text matter. It might be better to useannotationobject as @Baptism suggested because they will always be on top of theaxes, so on top of anything plotted in the figure. – Angelicaangelicoannotationis that it doesn't accept rotation argument. – Richardoannotation? – Richardoannotationof typeTextArrow, which has aTextRotationproperty (instead ofTextBox, which doesn't) and make the arrow invisible (set (LineStyleandHeadStyle) and/orColortonone). – Baptism