MATLAB Multiple(parallel) box plots in single figure
Asked Answered
A

2

5

I'm using the boxplot function in MATLAB. I need to plot boxplots for 6 different datasets for 6 'XTicks' i.e each tick in the x axis should contain 6 corresponding boxes, whiskers, median lines and set of outliers within it's domain. I tried manipulating the 'XTick' property by setting offsets for each variable, but it doesn't apply for boxplot() as it would for a normal plot(). I'm also not able to add legends.

A 3 variable equivalent of my problem would like the following:

enter image description here

Edit:

The following is the code snippet that needs to be modified

TreadmillData = randi([20,200],69,6);
Speeds = {'1.5mph' '2.5mph' '3.5mph' '4.5mph' '5.5mph' '6.5mph'};
DeviceColors = {'r' 'g' 'c' [0.5 0 0.5] 'b' [1 0.5 0]};
Pedometer1 = TreadmillData(1:7:end,:);
Pedometer2 = TreadmillData(2:7:end,:);
Pedometer3 = TreadmillData(3:7:end,:);
Pedometer4 = TreadmillData(4:7:end,:);
Pedometer5 = TreadmillData(5:7:end,:);
Pedometer6 = TreadmillData(6:7:end,:);

GroupedData = {Pedometer1 Pedometer2 Pedometer3 Pedometer4 Pedometer5 Pedometer6}; 

legendEntries = {'dev1' 'dev2' 'dev3' 'dev4' 'dev5' 'dev6'};

figure;
Xt = 20:20:120;
Xt_Offset = [-15,-10,-5,5,10,15];

for i=1:6 
    boxplot(GroupedData{i},'Color',DeviceColors{i});
    set(gca,'XTick',Xt+Xt_Offset(i));
    if i==3
        set(gca,'XTickLabel',Speeds);
    end
    hold on;
end
xlabel('Speed');ylabel('Step Count'); grid on;
legend(legendEntries);

Any help would be appreciated!

Antechamber answered 19/3, 2015 at 22:6 Comment(2)
Post some code to illustrate the problemVersify
8.4.0.150421 (R2014b)Antechamber
V
5

I've made some modifications to your code. I've tested this in R2014b.

TreadmillData = randi([20,200],69,6);
Speeds = {'1.5mph' '2.5mph' '3.5mph' '4.5mph' '5.5mph' '6.5mph'};
DeviceColors = {'r' 'g' 'c' [0.5 0 0.5] 'b' [1 0.5 0]};
Pedometer1 = TreadmillData(1:7:end,:);
Pedometer2 = TreadmillData(2:7:end,:);
Pedometer3 = TreadmillData(3:7:end,:);
Pedometer4 = TreadmillData(4:7:end,:);
Pedometer5 = TreadmillData(5:7:end,:);
Pedometer6 = TreadmillData(6:7:end,:);

GroupedData = {Pedometer1 Pedometer2 Pedometer3 Pedometer4 Pedometer5 Pedometer6}; 

legendEntries = {'dev1' 'dev2' 'dev3' 'dev4' 'dev5' 'dev6'};

N = numel(GroupedData);
delta = linspace(-.3,.3,N); %// define offsets to distinguish plots
width = .2; %// small width to avoid overlap
cmap = hsv(N); %// colormap
legWidth = 1.8; %// make room for legend

figure;
hold on;

for ii=1:N %// better not to shadow i (imaginary unit)
    %if ii~=ceil(N/2)
    %    labels = repmat({''},1,N); %// empty labels
    %else
        labels = Speeds; %// center plot: use real labels
    %end
    boxplot(GroupedData{ii},'Color', DeviceColors{ii}, 'boxstyle','filled', ...
        'position',(1:numel(labels))+delta(ii), 'widths',width, 'labels',labels)
        %// plot filled boxes with specified positions, widths, labels
    plot(NaN,1,'color',DeviceColors{ii}); %// dummy plot for legend
end
xlabel('Speed'); ylabel('Step Count'); grid on;
xlim([1+2*delta(1) numel(labels)+legWidth+2*delta(N)]) %// adjust x limits, with room for legend

legend(legendEntries);

enter image description here

Versify answered 19/3, 2015 at 23:30 Comment(10)
Thanks a lot @Luis Can you also add on regarding the problem with the legend? Also, XTick labels appears momentarily while the plot is updating and disappears in the end. using 'hold on' inside the for loop doesn't help retain the labels either.Antechamber
@Antechamber See updated answer. I've tested in R2014b, and modified the code to solve the label issue in R2014b. Also, I've added the legend. Note that for the legend to work you need to create dummy plots with the same colorsVersify
@Antechamber The labels shown are those from the last iteration. That's why they appear a little offset to the right. I haven't found a way to solve thatVersify
Thx for the dummy plot trick @Luis Mendo. I have a nice legend now (using 'LineWidth' for a thicker line). I felt I needed to post a solution for displaying the labels in the center of the groups to express my gratitude ;)Shove
@Shove That definitely looks better :-)Versify
I realize this is an old post, but this code only works in its current form if there are 6 categories and 6 speeds. Changing it to two groups breaks the code. Also the xlim computation should depend on the speeds not the number of groups. Anyway the solution is very good! I adjusted the snippet for my needs and it works perfectlyGreeting
@Luis Mendo @Greeting I believe 'position',(1:N)+delta(ii) needs to be changed to 'position',(1:numel(labels))+delta(ii). The original solution worked as it was 6x6 (or NxN in general). Making this change should make it work on any shape of data - at least it worked for me.Carpus
@Carpus Yes, I think you are right. Edited. Thank you!Versify
@LuisMendo Was working on this last night, vaguely recall that in the xlim call N+legWidth+2*delta(N), I think the first N also needs to be replaced with numel(labels) - but this is cosmetic and hopefully people will be able to figure out themselves. Also currently ylim is not dynamic but based on the very last boxplot data. I have also managed to center the labels by instead of doing 1:N, use [1:ceil(N/2)-1 ceil(N/2)+1:N ceil(N/2)] as loop index, and moving the phantom plots for legends outside in another loop from 1:N. Have to say: this is an excellent script!Carpus
@Carpus I just corrected that N. Thanks again!Versify
S
4

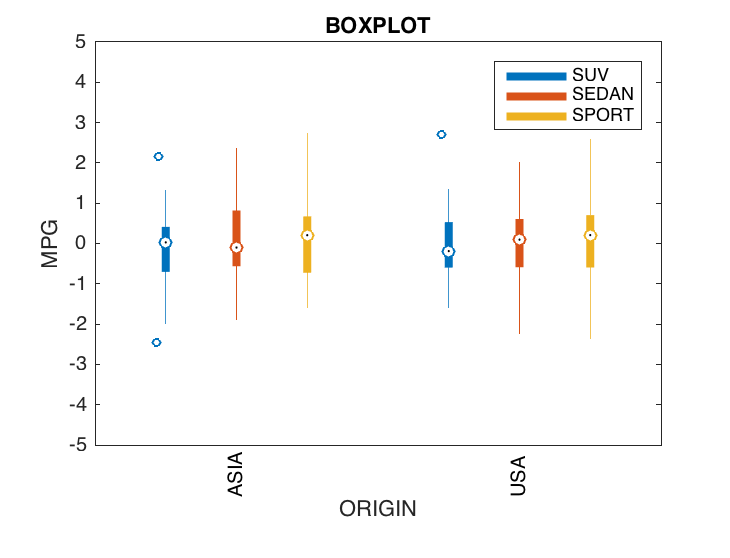
Here is a solution for plotting several boxplot. You have to group all the data in a single matrix, each group being separated by a column of Nan. After that, you can simply plot a single regular boxplot with ad-hoc options such as colors and labels.

enter image description here

The following example uses 2 groups of 3, so 7 columns. The 4 first lines of data:

    0.6993    0.0207   -0.7485       NaN    0.5836   -0.1763   -1.8468
   -0.0494   -1.5411    0.8022       NaN    2.7124   -0.0636   -2.3639
    0.9134    0.7106   -0.1375       NaN   -0.2200   -0.2528   -0.8350
   -0.5655    1.3820    0.6038       NaN   -0.7563   -0.9779    0.3789

And the code:

figure('Color', 'w');
c = colormap(lines(3));


A = randn(60,7);        % some data
A(:,4) = NaN;           % this is the trick for boxplot
C = [c; ones(1,3); c];  % this is the trick for coloring the boxes


% regular plot
boxplot(A, 'colors', C, 'plotstyle', 'compact', ...
    'labels', {'','ASIA','','','','USA',''}); % label only two categories
hold on;
for ii = 1:3
    plot(NaN,1,'color', c(ii,:), 'LineWidth', 4);
end

title('BOXPLOT');
ylabel('MPG');
xlabel('ORIGIN');
legend({'SUV', 'SEDAN', 'SPORT'});

set(gca, 'XLim', [0 8], 'YLim', [-5 5]);
Shove answered 5/1, 2016 at 17:17 Comment(1)
In addition, if you want the three boxes to be closer together, then specify the position argument in boxplot. For example: positions = [1, 1.25, 1.5, 2, 2.5, 2.75, 3]; h = boxplot(A, 'colors', C, 'widths', boxwidth, 'position', positions, ... 'labels', {'','ASIA','','','','USA',''});Biradial

© 2022 - 2024 — McMap. All rights reserved.