boxplot for all data in dataframe: error "'numpy.ndarray' object has no attribute 'boxplot'"
Asked Answered
K

1

5

I am trying to display in a subplot all the boxplots corresponding to each columns in my dataframe df.

I have read this question: Subplot for seaborn boxplot and tried to implement the given solution:

import pandas as pd
import numpy as np
import seaborn as sns
import matplotlib.pyplot as plt

d = {'col1': [1, 2, 5.5, 100], 'col2': [3, 4, 0.2, 3], 'col3': [1, 4, 6, 30], 'col4': [2, 24, 0.2, 13], 'col5': [9, 84, 0.9, 3]}
df = pd.DataFrame(data=d)

names = list(df.columns)
f, axes = plt.subplots(round(len(names)/3), 3)  
y = 0;
for name in names:
    sns.boxplot(x= df[name], ax=axes[y])
    y = y + 1

Unfortunately I get an error

---------------------------------------------------------------------------
AttributeError                            Traceback (most recent call last)
<ipython-input-111-489a538377fc> in <module>
      3 y = 0;
      4 for name in names:
----> 5     sns.boxplot(x= df[name], ax=axes[y])
      6     y = y + 1
AttributeError: 'numpy.ndarray' object has no attribute 'boxplot'

I understand there is a problem with df[name] but I can't see how to fix it.

Would someone be able to point me in the right direction?

Thank you very much.

Keverne answered 30/4, 2020 at 15:15 Comment(0)
L
10

The problem comes from passing ax=axes[y] to boxplot. axes is a 2-d numpy array with shape (2, 3), that contains the grid of Matplotlib axes that you requested. So axes[y] is a 1-d numpy array that contains three Matplotlib AxesSubplotobjects. I suspect boxplot is attempting to dispatch to this argument, and it expects it to be an object with a boxplot method. You can fix this by indexing axes with the appropriate row and column that you want to use.

Here's your script, with a small change to do that:

import pandas as pd
import numpy as np
import seaborn as sns
import matplotlib.pyplot as plt

d = {'col1': [1, 2, 5.5, 100], 'col2': [3, 4, 0.2, 3], 'col3': [1, 4, 6, 30], 'col4': [2, 24, 0.2, 13], 'col5': [9, 84, 0.9, 3]}
df = pd.DataFrame(data=d)

names = list(df.columns)
f, axes = plt.subplots(round(len(names)/3), 3)  
y = 0;
for name in names:
    i, j = divmod(y, 3)
    sns.boxplot(x=df[name], ax=axes[i, j])
    y = y + 1

plt.tight_layout()
plt.show()

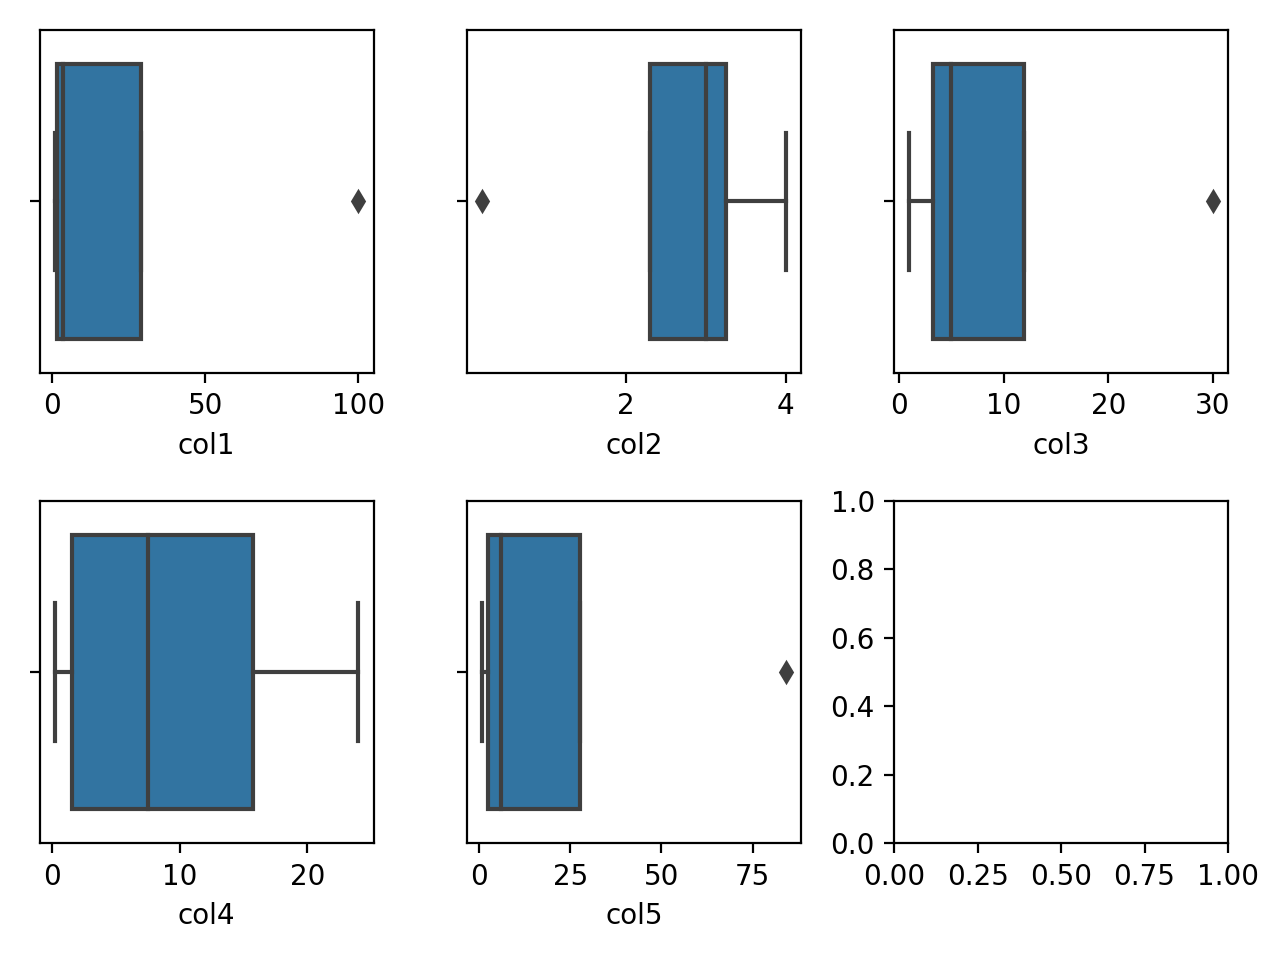
The plot:

plot

Lobotomy answered 30/4, 2020 at 16:23 Comment(0)

© 2022 - 2024 — McMap. All rights reserved.