Subplot for seaborn boxplot
Asked Answered
A

3

64

I have a dataframe like this

import seaborn as sns
import pandas as pd
%pylab inline

df = pd.DataFrame({'a' :['one','one','two','two','one','two','one','one','one','two'], 
                   'b': [1,2,1,2,1,2,1,2,1,1], 
                   'c': [1,2,3,4,6,1,2,3,4,6]})

A single boxplot is OK:

sns.boxplot(y="b", x="a", data=df, orient='v')

But I want to build a subplot for all variables. I tried:

names = ['b', 'c']
plt.subplots(1,2)
sub = []

for name in names:
    ax = sns.boxplot(  y=name, x= "a", data=df,  orient='v' )
    sub.append(ax)

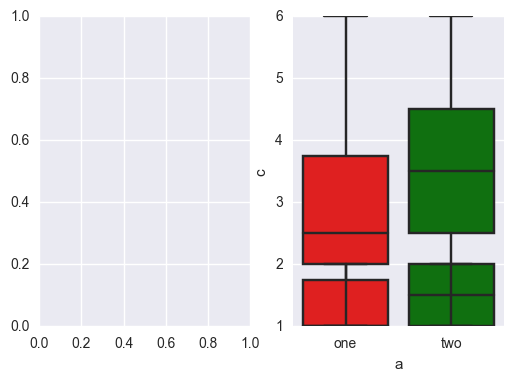
but it outputs:

enter image description here

Abdias answered 29/12, 2016 at 16:59 Comment(0)
S
138

We create the figure with the subplots:

f, axes = plt.subplots(1, 2)

Where axes is an array with each subplot.

Then we tell each plot in which subplot we want them with the argument ax.

sns.boxplot(  y="b", x= "a", data=df,  orient='v' , ax=axes[0])
sns.boxplot(  y="c", x= "a", data=df,  orient='v' , ax=axes[1])

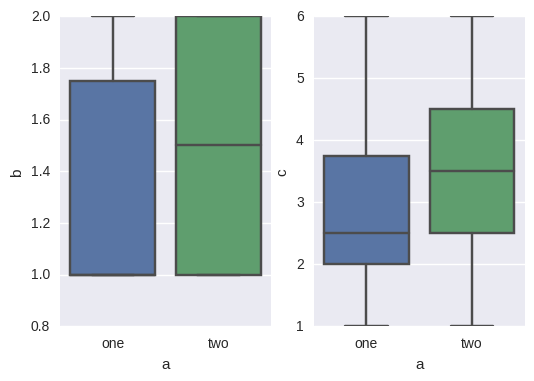
And the result is:

enter image description here

Swept answered 29/12, 2016 at 18:4 Comment(0)
N
10

If you wish to iterate through multiple different subplots, use plt.subplots:

import matplotlib.pyplot as plt

# Creating subplot axes
fig, axes = plt.subplots(nrows,ncols)

# Iterating through axes and names
for name, ax in zip(names, axes.flatten()):
    sns.boxplot(y=name, x= "a", data=df, orient='v', ax=ax)

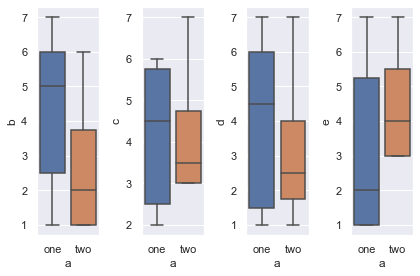
Working example:

import numpy as np

# example data
df = pd.DataFrame({'a' :['one','one','two','two','one','two','one','one','one','two'], 
                   'b': np.random.randint(1,8,10), 
                   'c': np.random.randint(1,8,10),
                   'd': np.random.randint(1,8,10),
                   'e': np.random.randint(1,8,10)})

names = df.columns.drop('a')
ncols = len(names)
fig, axes = plt.subplots(1,ncols)

for name, ax in zip(names, axes.flatten()):
    sns.boxplot(y=name, x= "a", data=df, orient='v', ax=ax)
    
plt.tight_layout()

enter image description here

Nightshirt answered 18/3, 2021 at 16:31 Comment(0)
A
4
names = ['b', 'c']
fig, axes = plt.subplots(1,2)

for i,t in enumerate(names):
    sns.boxplot(y=t, x="a", data=df, orient='v', ax=axes[i % 2])

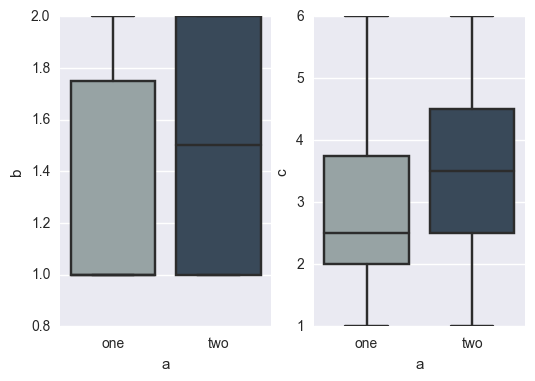
Example:

names = ['b', 'c']
fig, axes = plt.subplots(1,2)
sns.set_style("darkgrid")
flatui = ["#95a5a6", "#34495e"]

for i,t in enumerate(names):
    sns.boxplot(y=t, x= "a", data=df, orient='v', ax=axes[i % 2], palette=flatui)

enter image description here

Abdias answered 29/12, 2016 at 17:52 Comment(2)
Could you add an explanation as to why your solution should work?Bornie
@FabianSchultz i answered, see aboveAbdias

© 2022 - 2024 — McMap. All rights reserved.