Too many grid lines in log plot
Asked Answered
B

3

5

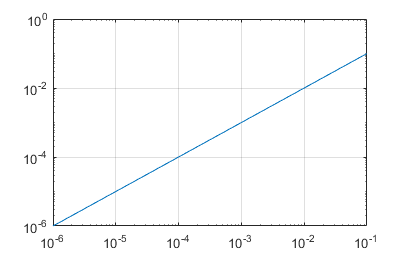
When I add grid lines to a log plot, it seems to automatically add every possible grid line, and I would like to only include the major lines. I tried turning the minor ticks off, but it has no effect.

For example:

loglog([0.000001,0.1],[0.000001,0.1])
grid on
gca.YAxis.MinorTick = 'off'

enter image description here

How can I just have grid lines at the labelled axes ticks?

Biogeography answered 28/6 at 2:52 Comment(3)
According to the docs on grid a bare call to grid should only set major ticks. Adding grid minor should add the minor ticks. This might be a bug (please do add your MATLAB version to the post), given the "minor" grid lines are indeed dashed as if they were minor, not major grid lines. You could try gca.YAxis.MinorTickAlpha = 0, rendering them fully transparent. If that doesn't work either, those lines are indeed somehow considered "major" grid lines, despite being dashed.Agribusiness
OK, my Matlab version is R2020b. gca.YAxis.MinorTickAlpha = 0 didn't work, and I suspect they are considered major.Biogeography
The weird part, to me, is that everything seems to suggest those lines are indeed considered "major", despite your true major lines being continuous, black grid lines (as you'd expect from major lines), whereas the rest are dashed as if they were minor.Agribusiness
T
5

The loglog plot has unusual axes, because the minor tickmarks are enabled by default as you'd normally expect from the major tickmarks. So this behaviour from the grid documentation is a bit of a grey area:

grid on displays the major grid lines for the current axes returned by the gca command. Major grid lines extend from each tick mark.

Note that most of the plots in the documentation for loglog use grid on and show the minor(ish) grids as you're seeing, so I doubt this is unexpected behaviour from MathWorks' perspective.

Since there's no way to call grid whilst explicitly disabling the minor grid lines, (as it should be the default behaviour), you'll have to manage the grids more granularly with set after creating the axes. You can enable the major grids and disable the minor grids in one command without using grid() at all...

Tested in R2020b Update 5:

loglog([0.000001,0.1],[0.000001,0.1])
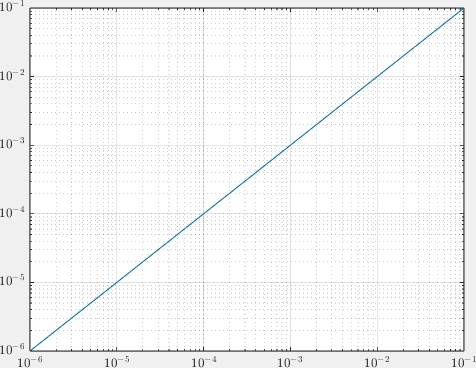
set(gca,'xminorgrid','off','yminorgrid','off','xgrid','on','ygrid','on')

plot without minor gridlines


Edit: From conversation in the comments, Luis suggested that grid on, grid minor should work. However, testing in R2020b it does not. Calling these commands in two separate calls does work the same way as using set above:

loglog([0.000001,0.1],[0.000001,0.1])
grid on
grid minor

I assume because the graphics buffer has to be flushed before grid minor works to remove gridlines, maybe because if not there's nothing there to remove. You could disguise this as a single line using drawnow to flush the buffer, but at that point I think I'd recommend just using set shown above

loglog([0.000001,0.1],[0.000001,0.1])
grid on; drawnow(); grid minor

Speculating, maybe the author of loglog decided the minor grids with their variable spacing made the plot look more "logish"? i.e. it's more obviously a nonlinear scale.

Topper answered 28/6 at 7:34 Comment(5)
Your note would make sense. This should be clearly documented though and, as it goes against the regular behaviour of grid as described by its docs, appears to be a bug IMOAgribusiness
Since there's no way to call grid whilst explicitly disabling the minor grid lines: isn't that what grid on, grid minor does?Danais
@Luis, the "fun" thing about these grid lines is that grid on, grid minor doesn't work to disable the minor gridlines, neither does grid on; grid minor (functionally equivalent here, basically two commands in one). However, separate calls to grid on and grid minor does work. I suspect it needs to clear the graphics buffer before it can disable the minor gridlines using grid, because grid on, drawnow, grid minor does work. Edited my answer to reflect thisTopper
@Topper Ah, I see. Nice edit into your answer; sad that I can't upvote again :-)Danais
Thanks, both grid on; drawnow(); grid minor and set(gca,'xminorgrid','off','yminorgrid','off','xgrid','on','ygrid','on') work.Biogeography
B
4

The grids follow the ticks, so

loglog([0.000001,0.1],[0.000001,0.1])
grid on
set(gca(),'XTick',logspace(-6,-1,6),'YTick',logspace(-6,-1,6),'XMinorGrid','off','YMinorGrid','off')

give you

enter image description here

Blas answered 28/6 at 6:15 Comment(4)
This code produces the same graph I had before - it may be a bug since my version is 2020b.Biogeography
loglog([0.000001,0.1],[0.000001,0.1]) set(gca(),'XTick',logspace(-6,-1,6),'YTick',logspace(-6,-1,6),'XMinorGrid','off','YMinorGrid','off','XGrid','on','YGrid','on')Blas
@MattMajic If you omit the "grid on", no grid is visible, right? Can you try the other workaround in the previous comment?Blas
Since Iv'e updated the version to 2020b update 8, both your workarounds work. But I would still like a more automatic approach if possible.Biogeography
D
2

The other answers provide solutions, but do not explain why your code does not work. For clarity, it should be noted first that

  • the gca function gives the current axes object;
  • the property YAxis of the latter refers to a numeric ruler object, which is a child of the axes.

There are two problems with your code. The first problem is that

gca.YAxis.MinorTick = 'off'

does not set a property of the numeric ruler within the current axes. You cannot directly apply dot indexing to a function output; you need to do one of the following:

  • assign it first to a variable:

    a = gca;
    a.YAxis.MinorTick = 'off';
    
  • use parentheses (thanks, @CrisLuengo!)

    gca().YAxis.MinorTick = 'off';
    
  • use get and set (more cumbersome):

    set(get(gca, 'YAxis'), 'MinorTick', 'off')
    

What your code does is to create a struct called gca (thus shadowing the function with the same name) with the specified field, subfield and value. Not useful.

The second problem is that the MinorTick property of the numeric ruler only affects the minor ticks, not the minor grid lines. What you want to set is the YMinorGrid property of the current axes. So,

a = gca;
a.YMinorGrid = 'off';

does what you want.

Danais answered 28/6 at 12:26 Comment(4)
“You cannot directly apply dot indexing to a function output” You can since very recently. Don’t remember exactly when this was introduced, a few years ago.Tarver
Oh, apparently you need to include parenthesis for this: gca().YMinorGrid = 'off'. mathworks.com/help/matlab/matlab_prog/…Tarver
Introduced in R2019b.Tarver
@CrisLuengo Huh, good find!Danais

© 2022 - 2024 — McMap. All rights reserved.