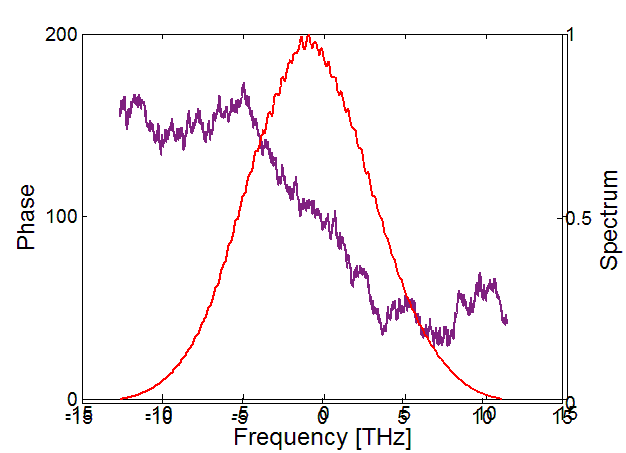
plotyy has been one of my favorite MATLAB functions to love to hate. It's a really useful function that I always seem to run into bugs with, to the point where I've completely stopped using it in favor of just stacking two (or more) axes objects and plotting to them separately. You can then set the Position property of the 'sub' axes to the same as your primary axes and they will stack nicely.
A functional example:
xx = linspace(-15,15,100);
yy1 = sin(xx);
yy2 = cos(xx);
f = figure('Color','white');

ax(1) = axes('Parent', f);
ax(2) = axes('Parent', f, 'Color', 'none', 'XTick', [], 'YAxisLocation', 'right');

p1 = plot(ax(1), xx, yy1);
hold(ax(2), 'on'); % Hold to preserve our axes properties set above
p2 = plot(ax(2), xx, yy2);
hold(ax(2), 'off');

ylabel(ax(1),'Phase','FontSize',18);
ylabel(ax(2),'Spectrum','FontSize',18);
set(ax,{'ycolor'},{'k';'k'});
set(p1,'LineWidth',2,'Color',[0.4940,0.1840,0.5560]);
set(p2,'LineWidth',2,'Color','red');
xlabel(ax(1),'Frequency [THz]','FontSize',18);
set(ax,'FontSize',14)

set(ax, 'ActivePositionProperty', 'position'); % Resize based on position rather than outerposition
set(ax(2), 'Position', get(ax(1), 'Position')); % Set last to account for any annotation changes
Along with stacking the axes you will also note that I have set the ActivePositionProperty to position (rather than outerposition). MATLAB resizes axes automatically when the Units property is set to Normalized, and it seems like this is the main spot where the issue is arising. On resizing, MATLAB also modifies the OuterPosition value for the second axes, causing it to resize the plot portion. The difference is small, [0 0 1 1] vs. [0 0.0371 1.0000 0.9599] in my case, but the effect is obviously very pronounced. You can use get and set to fix this, but you'll have to do it on every resize which is fairly annoying. The alternative is to resize based on the Position, which seems to alleviate the issue and is a tweak present in the R2015b implementation of plotyy. This also fixes plotyy except for cases where the window is very small, so I have left my answer with the more generic approach.


.figfile? How are you saving the.figin the first place? – Hunsakerplotyy: usingplotyyand setting some axes annotations with large font size, then saving it as.fig, then reloading it, will break the alignment of the two axes implicitly involved inplotyy. Alreadyxx=linspace(-15,15,100); yy1=sin(xx); yy2=cos(xx); [ax,p1,p2] = plotyy(xx, yy1, xx, yy2); ylabel(ax(1),'Phase','FontSize',18); ylabel(ax(2),'Spectrum','FontSize',18);will produce it when resizing the reloaded figure. Wonder if it's the same in HG2... – Hunsaker