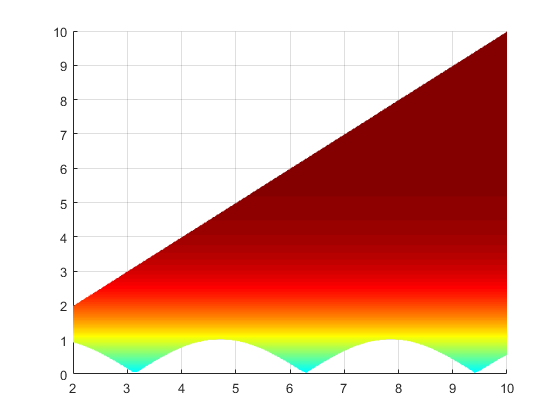
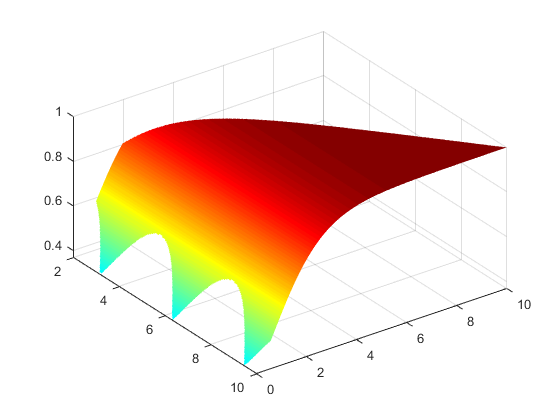
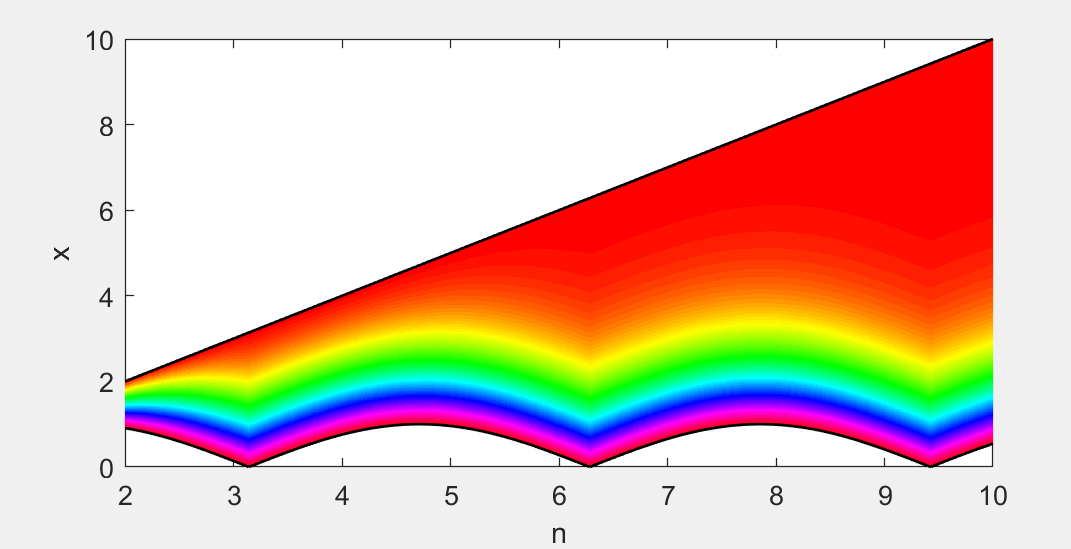
I'm trying to fill an area between two curves with respect to a function which depends on the values of the curves.
Here is the code of what I've managed to do so far
    i=50;
cc = @(xx,x,y) 1./(1+(exp(-xx)/(exp(-x)-exp(-y))));
n_vec = 2:0.1:10;
x_vec = linspace(2,10,length(n_vec));
y_vec = abs(sin(n_vec));
N=[n_vec,fliplr(n_vec)];
X=[x_vec,fliplr(y_vec)];
figure(1)
subplot(2,1,1)
hold on
plot(n_vec,x_vec,n_vec,y_vec)
hp = patch(N,X,'b')
plot([n_vec(i) n_vec(i)],[x_vec(i),y_vec(i)],'linewidth',5)
xlabel('n'); ylabel('x')
subplot(2,1,2)

xx = linspace(y_vec(i),x_vec(i),100);
plot(xx,cc(xx,y_vec(i),x_vec(i)))
xlabel('x'); ylabel('c(x)')
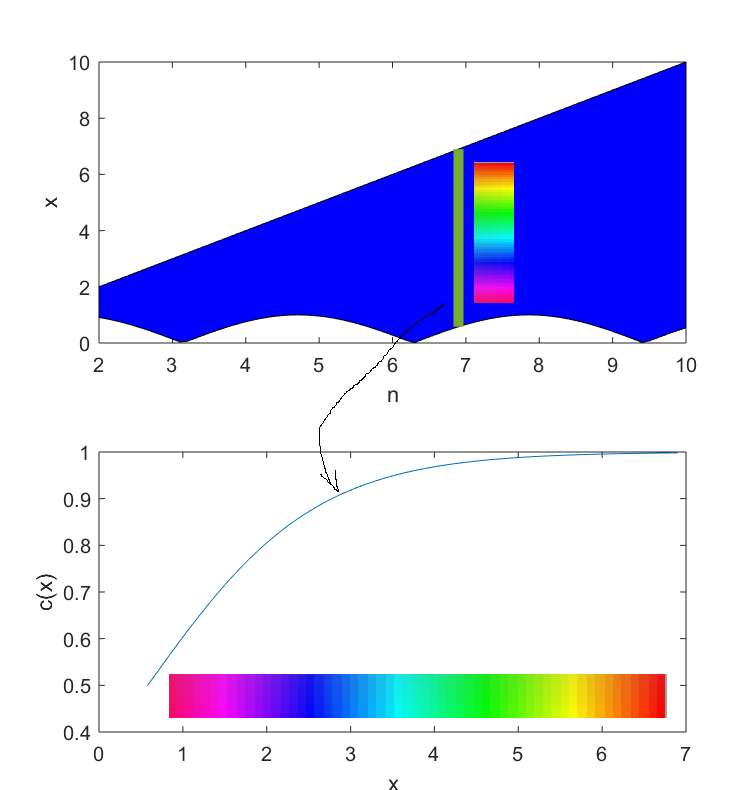
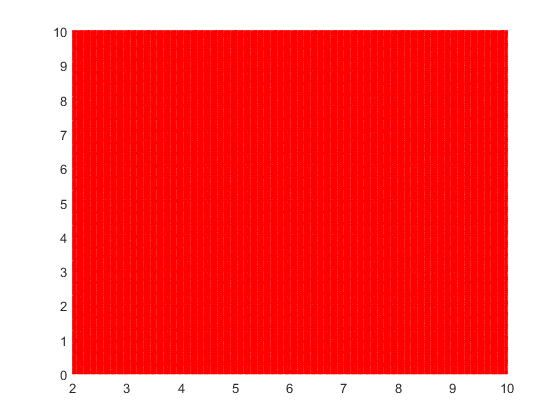
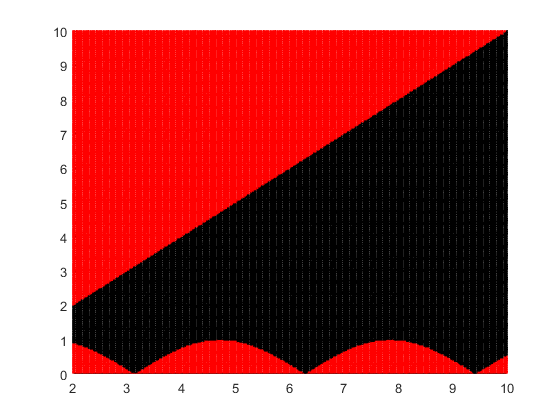
This code produces the following graph
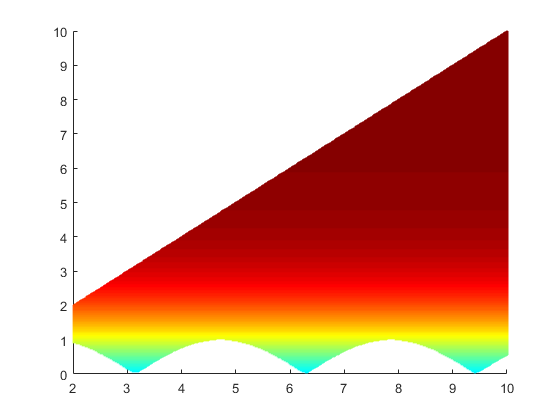
The color code which I've added represent the color coding that each line (along the y axis at a point on the x axis) from the area between the two curves should be.
Overall, the entire area should be filled with a gradient color which depends on the values of the curves.
I've assisted the following previous questions but could not resolve a solution
MATLAB fill area between lines
Patch circle by a color gradient
Filling between two curves, according to a colormap given by a function MATLAB
NOTE: there is no importance to the functional form of the curves, I would prefer an answer which refers to two general arrays which consist the curves.

