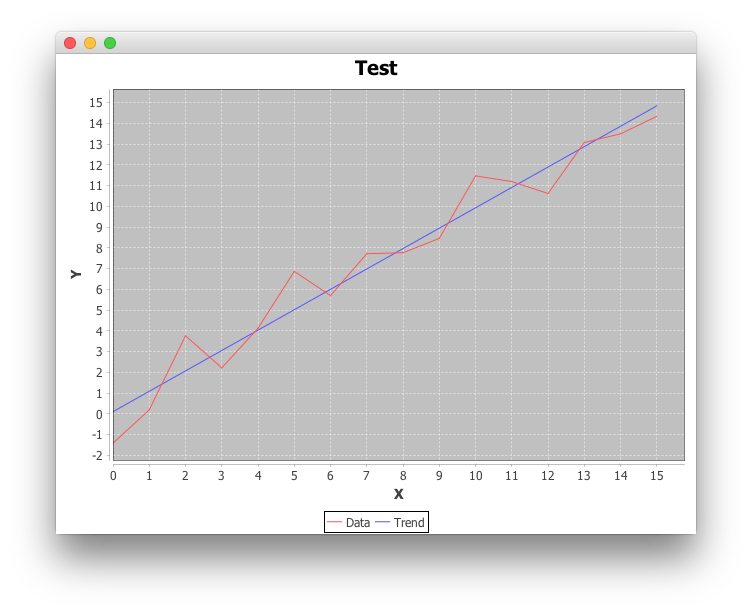
I am trying to through a linear regression line through individual separate clusters of data that share the same slope. However, though I have successfully plotted differing colors for the points themselves and graphed those successfully, my attempt at the line is not working.
Earlier I tried a hashset that ran through calling out the clusters by colors but that caused issues with the order in which the lines came in.
In this attempt, I tried to link the clusters through a number attachment and then call the lines based on that.
The first part of the code isn't really relevant as I didn't change anything there and that portion is working as intended. It calls up from other classes but as the problem isn't there, I don't think showing the other classes will be relevant to my current problem.
The second block of my code is where I am lost. Why does it seem as if it isn't compiling? No error is given and it is essentially just considered a phantom code as if my if statement is not being met to even initialize it?
Below is the first block which may not be relevant. The second block of code is my larger concern. Sorry I am new to these forums, I am not completely sure of the procedures of posing a question.
package clusters;

import java.awt.Color;
import java.awt.Graphics2D;
import java.awt.Paint;
import java.awt.geom.Rectangle2D;
import java.io.IOException;
import java.util.HashSet;
import java.util.TreeSet;

import org.jfree.chart.axis.NumberAxis;
import org.jfree.chart.plot.CrosshairState;
import org.jfree.chart.plot.FastScatterPlot;
import org.jfree.chart.plot.PlotRenderingInfo;
import org.jfree.ui.RectangleEdge;

public class ExtendedFastScatterPlot extends FastScatterPlot {

    /**
    *
    */
    private static final long serialVersionUID = 1L;

    int[] sizes;
    Paint[] colors;
    int[] shapes;

    public ExtendedFastScatterPlot(float[][] data, NumberAxis domainAxis, NumberAxis rangeAxis, int[] sizes,
            Paint[] colors, int[] shapes) {
        super(data, domainAxis, rangeAxis);
        this.sizes = sizes;
        this.colors = colors;
        this.shapes = shapes;
    }

    @Override
    public void render(Graphics2D g2, Rectangle2D dataArea, PlotRenderingInfo info, CrosshairState crosshairState) {
        // g2.setPaint(Color.BLUE);

        if (this.getData() != null) {
            for (int i = 0; i < this.getData()[0].length; i++) {
                float x = this.getData()[0][i];
                float y = this.getData()[1][i];
                int size = this.sizes[i];
                int transX = (int) this.getDomainAxis().valueToJava2D(x, dataArea, RectangleEdge.BOTTOM);
                int transY = (int) this.getRangeAxis().valueToJava2D(y, dataArea, RectangleEdge.LEFT);
                g2.setPaint(this.colors[i]);
                if (1 == this.shapes[i]) {
                    g2.fillRect(transX, transY, size, size);
                } else {
                    g2.fillOval(transX, transY, size, size);
                }
            }
        }
        g2.setColor(java.awt.Color.red);

        try {
            double[] lineData = GaussianElimination.calcLines();

            /*HashSet<Paint> paints = new HashSet<Paint>();
            for (Paint p : colors) {
                paints.add(p);
            }*/

            for (int index = 1; index < lineData.length; index++) {
            double slope = lineData[0];

            //for (Paint p : paints) {
In the part of the code below here, I attempted to create a line for each cluster by number in which in the Treeset should simulate new slope lines for it to run through. However, for some reason, it is as if the code doesn't exist. Nothing is running and I am curious if it has something to do with the break statement that I may have misplaced? I tried moving it before the index++ and after it and both returned the same results.
                for (int i = 0; i < this.getData()[0].length; i++) {

                    TreeSet<Double> xCoords = new TreeSet<Double>();
                    //if (colors[i].equals(p)) {
                        xCoords.add((double) this.getData()[0][i]);
                    //}
                //}
                double xleft = xCoords.first();
                double xright = xCoords.last();

                double yleft = slope * xleft + lineData[index];
                double yright = slope * xright + lineData[index];


                int txstart = (int) this.getDomainAxis().valueToJava2D(xleft, dataArea, RectangleEdge.BOTTOM);
                int tystart = (int) this.getRangeAxis().valueToJava2D(yleft, dataArea, RectangleEdge.LEFT);

                int txend = (int) this.getDomainAxis().valueToJava2D(xright, dataArea, RectangleEdge.BOTTOM);
                int tyend = (int) this.getRangeAxis().valueToJava2D(yright, dataArea, RectangleEdge.LEFT);

                g2.setPaint(Color.getHSBColor(i/(lineData.length - 1), 1, 1 ));
                g2.drawLine(txstart, tystart, txend, tyend);

                //index++;
                //if (index >= lineData.length) break;
                }
            }**

        } catch (IOException e) {
            System.out.println("Unable to open data files");
        }
    }
}
Here is the Graph Graph Result

