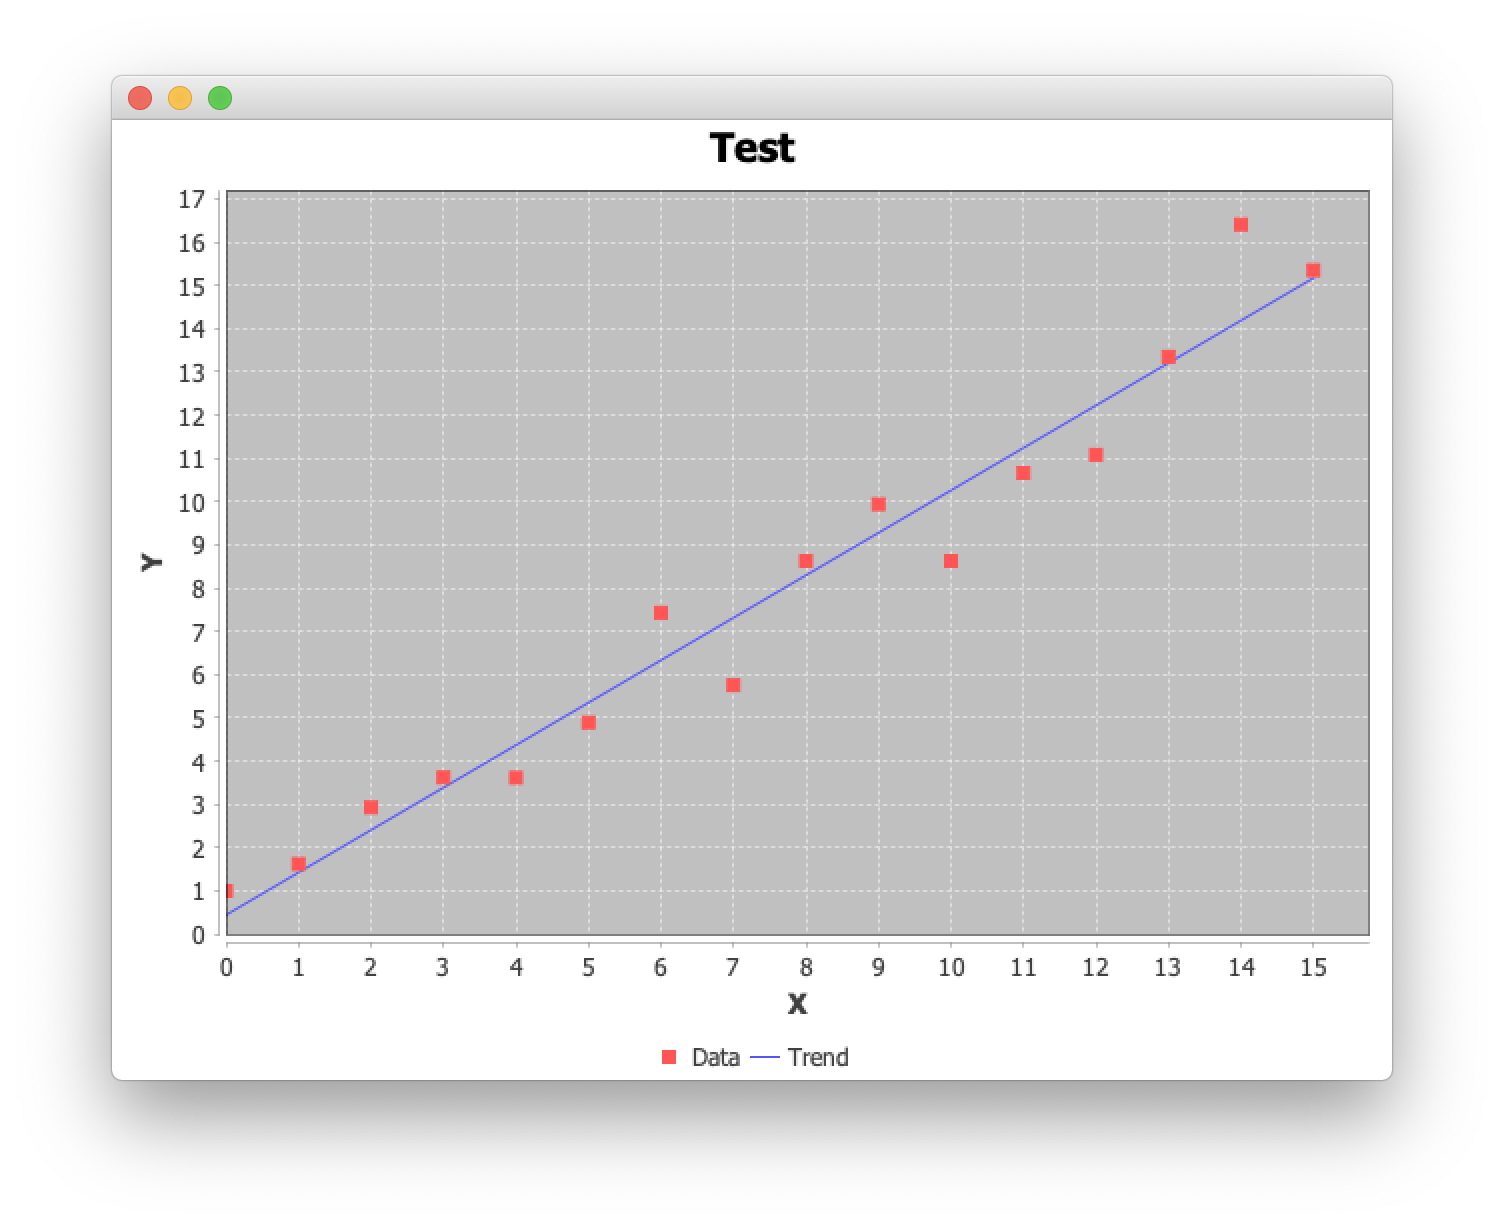
I have used JFreeChart to represent my array of x and y. These arrays get plotted just fine, however theregression line is broken and never gets drawn. All the functions work such as plotting values except drawinputpoint and drawregressionline function. Somehow these two never work. I don't mind drawwinginputpoint a lot, but I like to be able to drawregressionline. My array has correct data, so not sure what is the issue. I am importing my arrays data into dataset in createDateSetFromFile function. My Home_JFrame has targetx and targety array. These have arraylist and has Double data type.
package gradleproject2;

import java.awt.Color;
import java.io.File;
import java.io.IOException;
import java.util.Scanner;

import org.jfree.chart.ChartFactory;
import org.jfree.chart.ChartPanel;
import org.jfree.chart.JFreeChart;
import org.jfree.chart.plot.PlotOrientation;
import org.jfree.chart.plot.XYPlot;
import org.jfree.chart.renderer.xy.XYItemRenderer;
import org.jfree.chart.renderer.xy.XYLineAndShapeRenderer;
import org.jfree.chart.ui.ApplicationFrame;
import org.jfree.data.function.LineFunction2D;
import org.jfree.data.general.DatasetUtils;
import org.jfree.data.statistics.Regression;
import org.jfree.data.xy.XYDataset;
import org.jfree.data.xy.XYSeries;
import org.jfree.data.xy.XYSeriesCollection;
import gradleproject2.Home_JFrame;
import org.jfree.ui.RefineryUtilities;

public class PriceEstimator extends ApplicationFrame{

private static final long serialVersionUID = 1L;

    XYDataset inputData;
    JFreeChart chart;

    public static void main(String[] args) throws IOException {
        PriceEstimator demo = new PriceEstimator();
        demo.pack();
        RefineryUtilities.centerFrameOnScreen(demo);
        demo.setVisible(true);
                demo.drawRegressionLine();

                if (args.length >= 1 && args[0] != null) {
            // Estimate the linear function given the input data
            double regressionParameters[] = Regression.getOLSRegression(
                    demo.inputData, 0);
            double x = Double.parseDouble(args[0]);

            // Prepare a line function using the found parameters
            LineFunction2D linefunction2d = new LineFunction2D(
                    regressionParameters[0], regressionParameters[1]);
            // This is the estimated price
            double y = linefunction2d.getValue(x);

            demo.drawInputPoint(x, y);
    }
        }

    public PriceEstimator() throws IOException {
        super("Linear Regression");

        // Read sample data from prices.txt file
        inputData = createDatasetFromFile();

        // Create the chart using the sample data
        chart = createChart(inputData);

        ChartPanel chartPanel = new ChartPanel(chart);
        chartPanel.setPreferredSize(new java.awt.Dimension(500, 270));
        setContentPane(chartPanel);
    }

    public XYDataset createDatasetFromFile() throws IOException {
        ClassLoader classLoader = getClass().getClassLoader();

        XYSeriesCollection dataset = new XYSeriesCollection();
        XYSeries series = new XYSeries("Stock Item");

        // Read the price and the date
        for (int row = 0; row < Home_JFrame.targetx.size(); row++) {
                     series.add(Home_JFrame.targetx.get(row), Home_JFrame.targety.get(row));
                }

        dataset.addSeries(series);
                Home_JFrame.targetx.clear();
                 Home_JFrame.targety.clear();
        return dataset;
    }

    private JFreeChart createChart(XYDataset inputData) throws IOException {
        // Create the chart using the data read from the prices.txt file
        JFreeChart chart = ChartFactory.createScatterPlot(
                "Stock Price", "Stock Date", "Stock Opening Price", inputData,
                PlotOrientation.VERTICAL, true, true, false);

        XYPlot plot = chart.getXYPlot();
        plot.getRenderer().setSeriesPaint(0, Color.blue);
        return chart;
    }


    private void drawRegressionLine() {
        // Get the parameters 'a' and 'b' for an equation y = a + b * x,
        // fitted to the inputData using ordinary least squares regression.
        // a - regressionParameters[0], b - regressionParameters[1]
        double regressionParameters[] = Regression.getOLSRegression(inputData,
                0);

        // Prepare a line function using the found parameters
        LineFunction2D linefunction2d = new LineFunction2D(
                regressionParameters[0], regressionParameters[1]);

        // Creates a dataset by taking sample values from the line function
        XYDataset dataset = DatasetUtils.sampleFunction2D(linefunction2d,
                0D, 300, 100, "Fitted Regression Line");

        // Draw the line dataset
        XYPlot xyplot = chart.getXYPlot();
        xyplot.setDataset(1, dataset);
        XYLineAndShapeRenderer xylineandshaperenderer = new XYLineAndShapeRenderer(
                true, false);
        xylineandshaperenderer.setSeriesPaint(0, Color.YELLOW);
        xyplot.setRenderer(1, xylineandshaperenderer);
    }

    private void drawInputPoint(double x, double y) {
        // Create a new dataset with only one row
        XYSeriesCollection dataset = new XYSeriesCollection();
        String title = "Stock Date Distance: " + x + ", Stock Opening Price: " + y;
        XYSeries series = new XYSeries(title);
        series.add(x, y);
        dataset.addSeries(series);

        XYPlot plot = (XYPlot) chart.getPlot();
        plot.setDataset(2, dataset);
        XYItemRenderer renderer = new XYLineAndShapeRenderer(false, true);
        plot.setRenderer(2, renderer);
    }
}


DatasetUtils.sampleFunction2D(), but twosamplesmay be enough for aLineFunction2D; also consider using the dataset to to get the bounds, as shown here. – Runofthemill