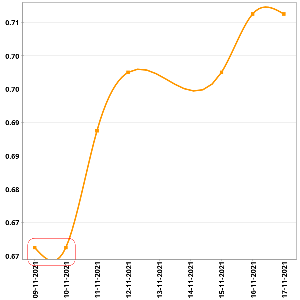
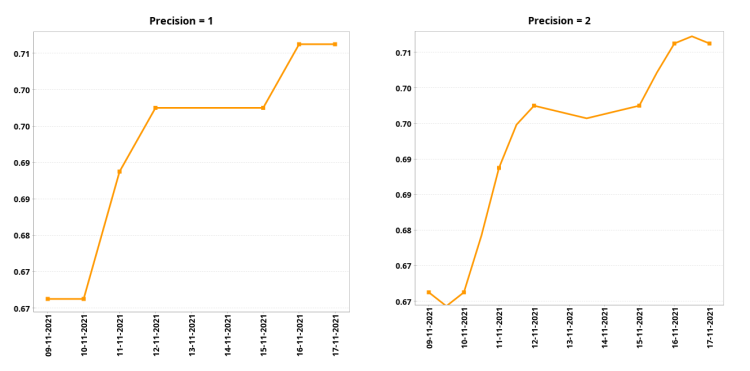
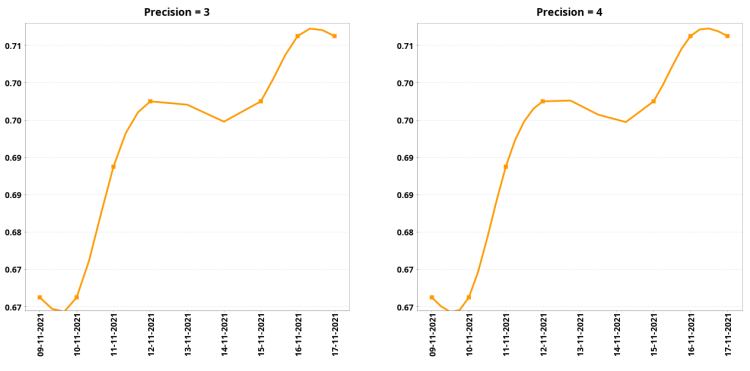
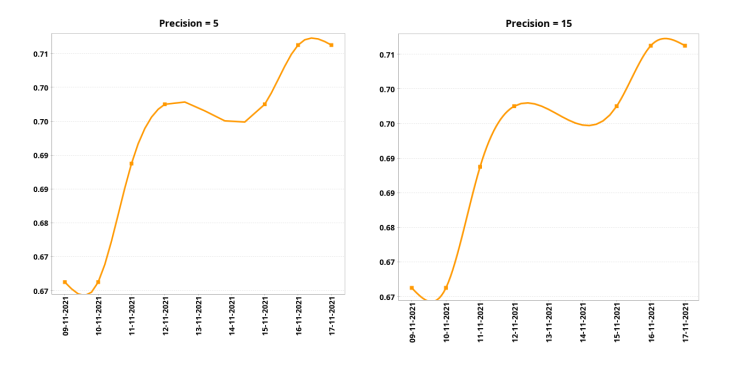
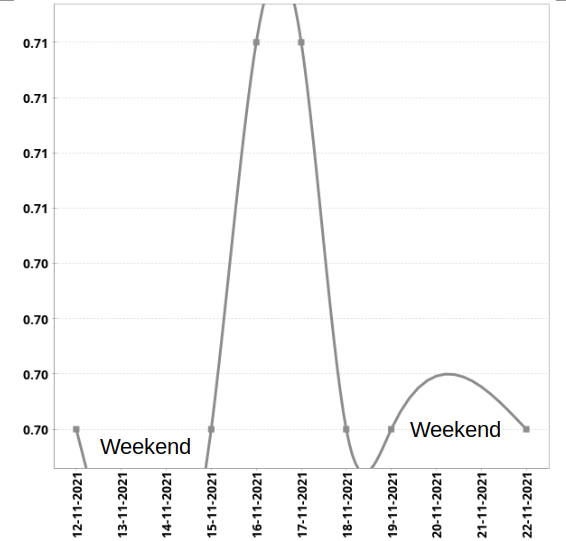
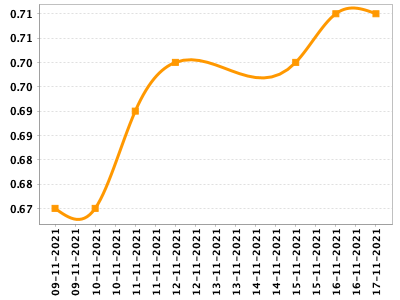
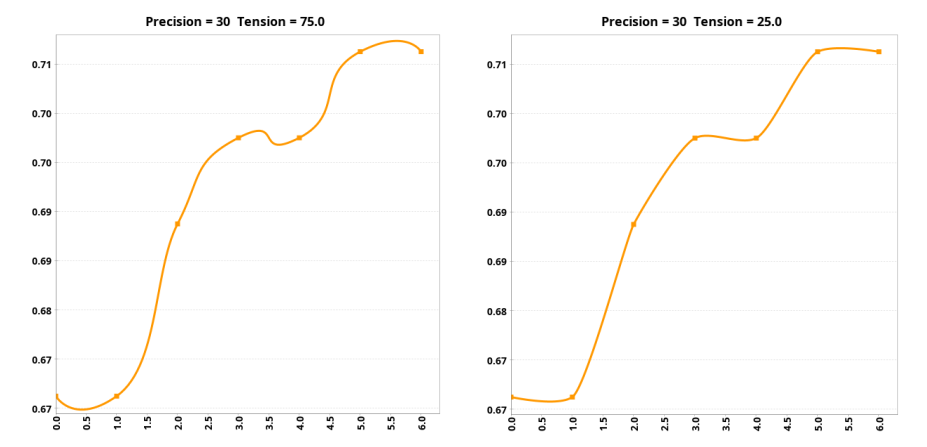
Following what It's pointed out in the question, one possible solution is to use a jfreechart renderer based in NURBS or Bezier curves instead of of natural cubic splines.
With Bezier curves It's possible to control how the curve bends arround the points by defining a parameter (tension).
I have cloned jfreechart from github and create a XYBezierRenderer class which extends XYLineAndShapeRenderer with a parameter (tension) to control the bending of the curve.
![enter image description here]()
The code for XYBezierRenderer class in shwon below:
package org.jfree.chart.renderer.xy;
import java.awt.GradientPaint;
import java.awt.Graphics2D;
import java.awt.Paint;
import java.awt.geom.GeneralPath;
import java.awt.geom.Point2D;
import java.awt.geom.Rectangle2D;
import java.util.ArrayList;
import java.util.List;
import java.util.Objects;
import org.jfree.chart.axis.ValueAxis;
import org.jfree.chart.event.RendererChangeEvent;
import org.jfree.chart.plot.PlotOrientation;
import org.jfree.chart.plot.PlotRenderingInfo;
import org.jfree.chart.plot.XYPlot;
import org.jfree.chart.util.GradientPaintTransformer;
import org.jfree.chart.api.RectangleEdge;
import org.jfree.chart.util.StandardGradientPaintTransformer;
import org.jfree.chart.internal.Args;
import org.jfree.data.xy.XYDataset;
/**
* A renderer that connects data points with Bezier cubic curves and/or
* draws shapes at each data point. This renderer is designed for use with
* the {@link XYPlot} class.
* <br><br>
*
* @since
*/
public class XYBezierRenderer extends XYLineAndShapeRenderer {
/**
* An enumeration of the fill types for the renderer.
*
* @since 1.0.17
*/
public static enum FillType {
/** No fill. */
NONE,
/** Fill down to zero. */
TO_ZERO,
/** Fill to the lower bound. */
TO_LOWER_BOUND,
/** Fill to the upper bound. */
TO_UPPER_BOUND
}
/**
* Represents state information that applies to a single rendering of
* a chart.
*/
public static class XYBezierState extends State {
/** The area to fill under the curve. */
public GeneralPath fillArea;
/** The points. */
public List<Point2D> points;
/**
* Creates a new state instance.
*
* @param info the plot rendering info.
*/
public XYBezierState(PlotRenderingInfo info) {
super(info);
this.fillArea = new GeneralPath();
this.points = new ArrayList<>();
}
}
/**
* Resolution of splines (number of line segments between points)
*/
private int precision;
/**
* Tension defines how sharply does the curve bends
*/
private double tension;
/**
* A flag that can be set to specify
* to fill the area under the spline.
*/
private FillType fillType;
private GradientPaintTransformer gradientPaintTransformer;
/**
* Creates a new instance with the precision attribute defaulting to 5,
* the tension attribute defaulting to 2
* and no fill of the area 'under' the spline.
*/
public XYBezierRenderer() {
this(5, 25, FillType.NONE);
}
/**
* Creates a new renderer with the specified precision and tension
* and no fill of the area 'under' (between '0' and) the spline.
*
* @param precision the number of points between data items.
* @param tension value to define how sharply the curve bends
*/
public XYBezierRenderer(int precision, double tension) {
this(precision, tension ,FillType.NONE);
}
/**
* Creates a new renderer with the specified precision
* and specified fill of the area 'under' (between '0' and) the spline.
*
* @param precision the number of points between data items.
* @param tension value to define how sharply the curve bends
* @param fillType the type of fill beneath the curve ({@code null}
* not permitted).
*
* @since 1.0.17
*/
public XYBezierRenderer(int precision, double tension, FillType fillType) {
super();
if (precision <= 0) {
throw new IllegalArgumentException("Requires precision > 0.");
}
if (tension <= 0) {
throw new IllegalArgumentException("Requires precision > 0.");
}
Args.nullNotPermitted(fillType, "fillType");
this.precision = precision;
this.tension = tension;
this.fillType = fillType;
this.gradientPaintTransformer = new StandardGradientPaintTransformer();
}
/**
* Returns the number of line segments used to approximate the Bezier
* curve between data points.
*
* @return The number of line segments.
*
* @see #setPrecision(int)
*/
public int getPrecision() {
return this.precision;
}
/**
* Set the resolution of splines and sends a {@link RendererChangeEvent}
* to all registered listeners.
*
* @param p number of line segments between points (must be > 0).
*
* @see #getPrecision()
*/
public void setPrecision(int p) {
if (p <= 0) {
throw new IllegalArgumentException("Requires p > 0.");
}
this.precision = p;
fireChangeEvent();
}
/**
* Returns the value of the tension which defines how sharply
* does the curve bends
*
* @return The value of tesion.
*
* @see #setTension(double)
*/
public double getTension() {
return this.tension;
}
/**
* Set the value of the tension which defines how sharply
* does the curve bends and sends a {@link RendererChangeEvent}
* to all registered listeners.
*
* @param t value of tension (must be > 0).
*
* @see #getTension()
*/
public void setTension(double t) {
if (t <= 0) {
throw new IllegalArgumentException("Requires tension > 0.");
}
this.tension = t;
fireChangeEvent();
}
/**
* Returns the type of fill that the renderer draws beneath the curve.
*
* @return The type of fill (never {@code null}).
*
* @see #setFillType(FillType)
*
* @since 1.0.17
*/
public FillType getFillType() {
return this.fillType;
}
/**
* Set the fill type and sends a {@link RendererChangeEvent}
* to all registered listeners.
*
* @param fillType the fill type ({@code null} not permitted).
*
* @see #getFillType()
*
* @since 1.0.17
*/
public void setFillType(FillType fillType) {
this.fillType = fillType;
fireChangeEvent();
}
/**
* Returns the gradient paint transformer, or {@code null}.
*
* @return The gradient paint transformer (possibly {@code null}).
*
* @since 1.0.17
*/
public GradientPaintTransformer getGradientPaintTransformer() {
return this.gradientPaintTransformer;
}
/**
* Sets the gradient paint transformer and sends a
* {@link RendererChangeEvent} to all registered listeners.
*
* @param gpt the transformer ({@code null} permitted).
*
* @since 1.0.17
*/
public void setGradientPaintTransformer(GradientPaintTransformer gpt) {
this.gradientPaintTransformer = gpt;
fireChangeEvent();
}
/**
* Initialises the renderer.
* <P>
* This method will be called before the first item is rendered, giving the
* renderer an opportunity to initialise any state information it wants to
* maintain. The renderer can do nothing if it chooses.
*
* @param g2 the graphics device.
* @param dataArea the area inside the axes.
* @param plot the plot.
* @param data the data.
* @param info an optional info collection object to return data back to
* the caller.
*
* @return The renderer state.
*/
@Override
public XYItemRendererState initialise(Graphics2D g2, Rectangle2D dataArea,
XYPlot plot, XYDataset data, PlotRenderingInfo info) {
setDrawSeriesLineAsPath(true);
XYBezierState state = new XYBezierState(info);
state.setProcessVisibleItemsOnly(false);
return state;
}
/**
* Draws the item (first pass). This method draws the lines
* connecting the items. Instead of drawing separate lines,
* a GeneralPath is constructed and drawn at the end of
* the series painting.
*
* @param g2 the graphics device.
* @param state the renderer state.
* @param plot the plot (can be used to obtain standard color information
* etc).
* @param dataset the dataset.
* @param pass the pass.
* @param series the series index (zero-based).
* @param item the item index (zero-based).
* @param xAxis the domain axis.
* @param yAxis the range axis.
* @param dataArea the area within which the data is being drawn.
*/
@Override
protected void drawPrimaryLineAsPath(XYItemRendererState state,
Graphics2D g2, XYPlot plot, XYDataset dataset, int pass,
int series, int item, ValueAxis xAxis, ValueAxis yAxis,
Rectangle2D dataArea) {
XYBezierState s = (XYBezierState) state;
RectangleEdge xAxisLocation = plot.getDomainAxisEdge();
RectangleEdge yAxisLocation = plot.getRangeAxisEdge();
// get the data points
double x1 = dataset.getXValue(series, item);
double y1 = dataset.getYValue(series, item);
double transX1 = xAxis.valueToJava2D(x1, dataArea, xAxisLocation);
double transY1 = yAxis.valueToJava2D(y1, dataArea, yAxisLocation);
// Collect points
if (!Double.isNaN(transX1) && !Double.isNaN(transY1)) {
Point2D p = plot.getOrientation() == PlotOrientation.HORIZONTAL
? new Point2D.Float((float) transY1, (float) transX1)
: new Point2D.Float((float) transX1, (float) transY1);
if (!s.points.contains(p))
s.points.add(p);
}
if (item == dataset.getItemCount(series) - 1) { // construct path
if (s.points.size() > 1) {
Point2D origin;
if (this.fillType == FillType.TO_ZERO) {
float xz = (float) xAxis.valueToJava2D(0, dataArea,
yAxisLocation);
float yz = (float) yAxis.valueToJava2D(0, dataArea,
yAxisLocation);
origin = plot.getOrientation() == PlotOrientation.HORIZONTAL
? new Point2D.Float(yz, xz)
: new Point2D.Float(xz, yz);
} else if (this.fillType == FillType.TO_LOWER_BOUND) {
float xlb = (float) xAxis.valueToJava2D(
xAxis.getLowerBound(), dataArea, xAxisLocation);
float ylb = (float) yAxis.valueToJava2D(
yAxis.getLowerBound(), dataArea, yAxisLocation);
origin = plot.getOrientation() == PlotOrientation.HORIZONTAL
? new Point2D.Float(ylb, xlb)
: new Point2D.Float(xlb, ylb);
} else {// fillType == TO_UPPER_BOUND
float xub = (float) xAxis.valueToJava2D(
xAxis.getUpperBound(), dataArea, xAxisLocation);
float yub = (float) yAxis.valueToJava2D(
yAxis.getUpperBound(), dataArea, yAxisLocation);
origin = plot.getOrientation() == PlotOrientation.HORIZONTAL
? new Point2D.Float(yub, xub)
: new Point2D.Float(xub, yub);
}
// we need at least two points to draw something
Point2D cp0 = s.points.get(0);
s.seriesPath.moveTo(cp0.getX(), cp0.getY());
if (this.fillType != FillType.NONE) {
if (plot.getOrientation() == PlotOrientation.HORIZONTAL) {
s.fillArea.moveTo(origin.getX(), cp0.getY());
} else {
s.fillArea.moveTo(cp0.getX(), origin.getY());
}
s.fillArea.lineTo(cp0.getX(), cp0.getY());
}
if (s.points.size() == 2) {
// we need at least 3 points to Bezier. Draw simple line
// for two points
Point2D cp1 = s.points.get(1);
if (this.fillType != FillType.NONE) {
s.fillArea.lineTo(cp1.getX(), cp1.getY());
s.fillArea.lineTo(cp1.getX(), origin.getY());
s.fillArea.closePath();
}
s.seriesPath.lineTo(cp1.getX(), cp1.getY());
}
else if (s.points.size() == 3) {
Point2D[] pInitial = getInitalPoints(s);
pintar(pInitial, s);
Point2D[] pFinal = getFinalPoints(s);
pintar(pFinal, s);
}
else {
// construct Bezier curve
//System.out.println("Entra en construir curva larga... " + s.points.size());
int np = s.points.size(); // number of points
for(int i = 0; i < np - 1; i++) {
if(i == 0) {
//System.out.println("Entra en i= 0");
// 3 points, 2 lines (initial an final Bezier curves
Point2D[] initial3Points = new Point2D[3];
initial3Points[0] = s.points.get(0);
initial3Points[1] = s.points.get(1);
initial3Points[2] = s.points.get(2);
Point2D[] pInitial = calcSegmentPointsInitial(initial3Points);// TENSION = 1.5
pintar(pInitial, s);
}
if(i == np - 2) {
//System.out.println("Entra en i = np - 2");
Point2D[] final3Points = new Point2D[4];
final3Points[1] = s.points.get(np-3);
final3Points[2] = s.points.get(np-2);
final3Points[3] = s.points.get(np-1);
//No se define final3Points[4] pq no se usa
Point2D[] pFinal = calcSegmentPointsFinal(final3Points);//TENSION = 1.5
pintar(pFinal, s);
}
if ((i != 0) && (i != (np - 2))){
Point2D[] original4Points = new Point2D[4];
original4Points[0] = s.points.get(i - 1);
original4Points[1] = s.points.get(i);
original4Points[2] = s.points.get(i + 1);
original4Points[3] = s.points.get(i + 2);
Point2D[] pMedium = calculateSegmentPoints(original4Points);
pintar(pMedium, s);
}
}
}
// Add last point @ y=0 for fillPath and close path
if (this.fillType != FillType.NONE) {
if (plot.getOrientation() == PlotOrientation.HORIZONTAL) {
s.fillArea.lineTo(origin.getX(), s.points.get(
s.points.size() - 1).getY());
} else {
s.fillArea.lineTo(s.points.get(
s.points.size() - 1).getX(), origin.getY());
}
s.fillArea.closePath();
}
// fill under the curve...
if (this.fillType != FillType.NONE) {
Paint fp = getSeriesFillPaint(series);
if (this.gradientPaintTransformer != null
&& fp instanceof GradientPaint) {
GradientPaint gp = this.gradientPaintTransformer
.transform((GradientPaint) fp, s.fillArea);
g2.setPaint(gp);
} else {
g2.setPaint(fp);
}
g2.fill(s.fillArea);
s.fillArea.reset();
}
// then draw the line...
drawFirstPassShape(g2, pass, series, item, s.seriesPath);
}
// reset points vector
s.points = new ArrayList<>();
}
}
private void pintar(Point2D[] segmentPoints, XYBezierState s) {
double x;
double y;
//System.out.println("Precision: " + this.precision);
for (int t = 0 ; t <= this.precision; t++) {
double k = (double)t / this.precision;
double r = 1- k;
x = Math.pow(r, 3) * segmentPoints[0].getX() + 3 * k * Math.pow(r, 2) * segmentPoints[1].getX()
+ 3 * Math.pow(k, 2) * (1 - k) * segmentPoints[2].getX() + Math.pow(k, 3) * segmentPoints[3].getX();
y = Math.pow(r, 3) * segmentPoints[0].getY() + 3 * k * Math.pow(r, 2) * segmentPoints[1].getY()
+ 3 * Math.pow(k, 2) * (1 - k) * segmentPoints[2].getY() + Math.pow(k, 3) * segmentPoints[3].getY();
s.seriesPath.lineTo(x, y);
//System.out.println("Pintar, t = " + t + "\tk = " + k +"\t" + "\tx = " + x + "\ty = " + y);
}
}
private Point2D[] getFinalPoints(XYBezierState s) {
//System.out.println("getinFinalPoints");
//for(int i = 0; i< s.points.size(); i++) {
// Point2D p = s.points.get(i);
// System.out.println("Point" + i + "\tx = " + p.getX() + "\ty = " + p.getY());
//}
Point2D[] final3Points = new Point2D[4];
final3Points[1] = s.points.get(0);
final3Points[2] = s.points.get(1);
final3Points[3] = s.points.get(2);
//No se define final3Points[4] pq no se usa
Point2D[] pFinal = calcSegmentPointsFinal(final3Points);//TENSION = 1.5
return pFinal;
}
private Point2D[] getInitalPoints(XYBezierState s) {
//System.out.println("getInitialPoints");
//for(int i = 0; i< s.points.size(); i++) {
// Point2D p = s.points.get(i);
// System.out.println("Point" + i + "\tx = " + p.getX() + "\ty = " + p.getY());
//}
// 3 points, 2 lines (initial an final Bezier curves
Point2D[] initial3Points = new Point2D[3];
initial3Points[0] = s.points.get(0);
initial3Points[1] = s.points.get(1);
initial3Points[2] = s.points.get(2);
Point2D[] pInitial = calcSegmentPointsInitial(initial3Points);// TENSION = 1.5
return pInitial;
}
private Point2D[] calculateSegmentPoints(Point2D[] original4Points) {
//System.out.println("calcSegmentPoints");
double relativeTension = calcRelativetension(original4Points, false, false);
Point2D[] points = new Point2D[4];
points[0] = original4Points[1];
points[3] = original4Points[2];
//double modulo = Math.sqrt(Math.pow(original4Points[1].getX() - original4Points[2].getX(), 2) + Math.pow(original4Points[1].getY() - original4Points[2].getY(), 2));
//double tesionRelativa = modulo * tension / 4;
for(int i = 1; i < 3; i++) {
Point2D aux1 = calcUnitaryVector(original4Points[i-1], original4Points[i]);
Point2D aux2 = calcUnitaryVector(original4Points[i+1], original4Points[i]);
Point2D aux3 = calcUnitaryVector(aux2, aux1);
double x = original4Points[i].getX() + Math.pow(-1.0, i+1) * tension * aux3.getX();
double y = original4Points[i].getY() + Math.pow(-1.0, i+1) * tension * aux3.getY();
points[i] = new Point2D.Double(x, y);
}
return points;
}
private Point2D[] calcSegmentPointsInitial(Point2D[] original3P) {
//System.out.println("calcSegmentPointsInitial");
/*
* Each segment is defined by its two endpoints and two control points. A
* control point determines the tangent at the corresponding endpoint.
*/
Point2D[] points = new Point2D[4];
points[0] = original3P[0];// Endpoint 1
points[3] = original3P[1];// Endpoint 2
// Control point 1
Point2D auxInitial = calcUnitaryVector(original3P[0], original3P[1]);
points[1] = original3P[0];// new Point2D.Double(x0, y0);
// Control point 2
// Es el mismo vector que el anterior: Point2D aux1 =
// calcUnitaryVector(original4P[0], original4P[1]);
Point2D aux2 = calcUnitaryVector(original3P[2], original3P[1]);
Point2D aux3 = calcUnitaryVector(auxInitial, aux2);
double relativeTension = calcRelativetension(original3P, true, false);
double x = original3P[1].getX() + tension * aux3.getX();
double y = original3P[1].getY() + tension * aux3.getY();
points[2] = new Point2D.Double(x, y);
//for(int i = 0; i < 4; i++) {
// System.out.println("Point[" + i + "]\tx = " + points[i].getX() + "\ty = " + points[i].getY());
//}
return points;
}
private Point2D[] calcSegmentPointsFinal(Point2D[] original3P) {
//System.out.println("calcSegmentPointsFinal");
/*
* Each segment is defined by its two endpoints and two control points. A
* control point determines the tangent at the corresponding endpoint.
*/
Point2D[] points = new Point2D[4];
points[0] = original3P[2];// Endpoint 1
points[3] = original3P[3];// Endpoint 2
// Control point 2: points[2]
Point2D auxInitial = calcUnitaryVector(original3P[3], original3P[2]);
points[2] = original3P[3];// new Point2D.Double(x0, y0);
// Control point 1
Point2D aux1 = calcUnitaryVector(original3P[3], original3P[2]);
Point2D aux2 = calcUnitaryVector(original3P[1], original3P[2]);
Point2D aux3 = calcUnitaryVector(aux1, aux2);
double relativeTension = calcRelativetension(original3P, false, true);
double x = original3P[2].getX() + tension * aux3.getX();
double y = original3P[2].getY() + tension * aux3.getY();
points[1] = new Point2D.Double(x, y);
//for(int i = 0; i < 4; i++) {
// System.out.println("Point[" + i + "]\tx = " + points[i].getX() + "\ty = " + points[i].getY());
//}
return points;
}
private double calcRelativetension (Point2D[] original4P, boolean initial, boolean end) {
if(initial) {
double module1 = Math.sqrt(
Math.pow(original4P[1].getX() - original4P[0].getX(), 2) +
Math.pow(original4P[1].getY() - original4P[0].getY(), 2));
double module2 = Math.sqrt(
Math.pow(original4P[2].getX() - original4P[1].getX(), 2) +
Math.pow(original4P[2].getY() - original4P[1].getY(), 2));
double moduleTotal = module1 + module2;
return moduleTotal * tension / 3;
}
if(end) {
double module2 = Math.sqrt(
Math.pow(original4P[2].getX() - original4P[1].getX(), 2) +
Math.pow(original4P[2].getY() - original4P[1].getY(), 2));
double module3 = Math.sqrt(
Math.pow(original4P[3].getX() - original4P[2].getX(), 2) +
Math.pow(original4P[3].getY() - original4P[2].getY(), 2));
double moduleTotal = module2 + module3;
return moduleTotal * tension / 3;
}
double module1 = Math.sqrt(
Math.pow(original4P[1].getX() - original4P[0].getX(), 2) +
Math.pow(original4P[1].getY() - original4P[0].getY(), 2));
double module2 = Math.sqrt(
Math.pow(original4P[2].getX() - original4P[1].getX(), 2) +
Math.pow(original4P[2].getY() - original4P[1].getY(), 2));
double module3 = Math.sqrt(
Math.pow(original4P[3].getX() - original4P[2].getX(), 2) +
Math.pow(original4P[3].getY() - original4P[2].getY(), 2));
double moduleTotal = module1 + module2 + module3;
return moduleTotal * tension / 4;
}
private Point2D calcUnitaryVector(Point2D pOrigin, Point2D pEnd) {
double module = Math.sqrt(Math.pow(pEnd.getX() - pOrigin.getX(), 2) +
Math.pow(pEnd.getY() - pOrigin.getY(), 2));
if (module == 0) {
return null;
}
return new Point2D.Double((pEnd.getX() - pOrigin.getX()) / module,
(pEnd.getY() - pOrigin.getY()) /module);
}
/**
* Tests this renderer for equality with an arbitrary object.
*
* @param obj the object ({@code null} permitted).
*
* @return A boolean.
*/
@Override
public boolean equals(Object obj) {
if (obj == this) {
return true;
}
if (!(obj instanceof XYBezierRenderer)) {
return false;
}
XYBezierRenderer that = (XYBezierRenderer) obj;
if (this.precision != that.precision) {
return false;
}
if (this.fillType != that.fillType) {
return false;
}
if (!Objects.equals(this.gradientPaintTransformer, that.gradientPaintTransformer)) {
return false;
}
return super.equals(obj);
}
}

