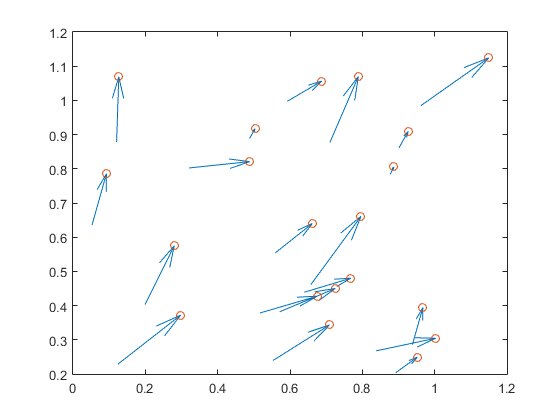
You can't simply use something like plot(X+U, Y+V, 'o') because quiver applies an automatically computed scale to U and V so that all arrows fit nicely in the figure. You need to include that scale.
Looking into quiver's code and replicating the part that computes that scale, you can proceed as follows:
%// Example data
x = rand(1,20);
y = rand(1,20);
u = rand(1,20);
v = rand(1,20);

%// Taken from "quiver.m". Computes autoscale
if min(size(x))==1, n=sqrt(numel(x)); m=n; else [m,n]=size(x); end
delx = diff([min(x(:)) max(x(:))])/n;
dely = diff([min(y(:)) max(y(:))])/m;
del = delx.^2 + dely.^2;
if del>0
    len = sqrt((u.^2 + v.^2)/del);
    maxlen = max(len(:));
else
    maxlen = 0;
end
if maxlen>0
    autoscale = 0.9 / maxlen;
else
    autoscale = 0.9;
end

%// quiver plot
quiver(x, y, u, v)
hold on

%// plot marker at arrow tips, including computed autoscale
plot(x+autoscale*u, y+autoscale*v, 'o')
If you specify a scale argument to quiver, that argument is a factor that multiplies the internally computed scale. So you have to include that in plot as well:
%// quiver plot including manual scale factor
quiver(x, y, u, v, .5)
hold on

%// plot marker at arrow tips, including computed autoscale and manual scale
plot(x+.5*autoscale*u, y+.5*autoscale*v, 'o')
![enter image description here]()


plot(x,y,'.')– Gondquiverapplies a scale to thoseU,V. You'd have to include that scale, which is not known a priori – Combscaleinput option! – Gondedit quiver?) 2)plot the arrows with something else. There are several FEX submissions. Dont have Matlab at the moment to play with it unfortunately. – Gondedit quiverroute! :-D – Comb