Updated slightly using the second output of legend mentioned by @nirvana-msu.
We can adjust the positions of the text and plot object in the legend by retrieving their current position and altering it. The position units of all items in the legend are normalized data units between 0 and 1.
Something like the following should work.
%// Create some random data and display
figure;
p = plot(rand(2,3));
[L, handles] = legend({'one', 'two', 'three'});

%// Get the text handles
texts = findall(handles, 'type', 'text');

%// Get the line handles
lines = findall(handles, 'type', 'line');

%// Get the XData of all the lines
poslines = get(lines, 'XData');

%// Subtract 1 from all the positions and take the absolute value
%// this will shift them to the other side as the xlims are [0 1]
set(lines, {'XData'}, cellfun(@(x)abs(x - 1), poslines, 'uni', 0))

%// Get the position of all of the text labels
postext = get(texts, 'Position');

%// Figure out where the lines ended up
xd = get(lines, 'xdata');
xd = cat(2, xd{:});

%// Have the labels be next to the line (with 0.05 padding)
positions = cellfun(@(x)[min(xd) - 0.05, x(2:3)], postext, 'uni', 0);
set(texts, {'Position'}, positions, ...
           'HorizontalAlignment', 'right');
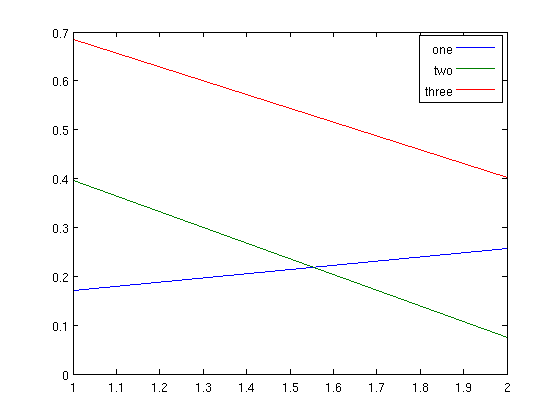
R2014a
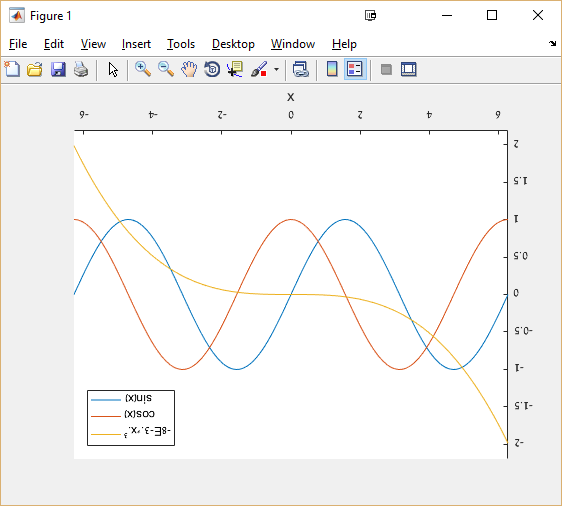
![enter image description here]()
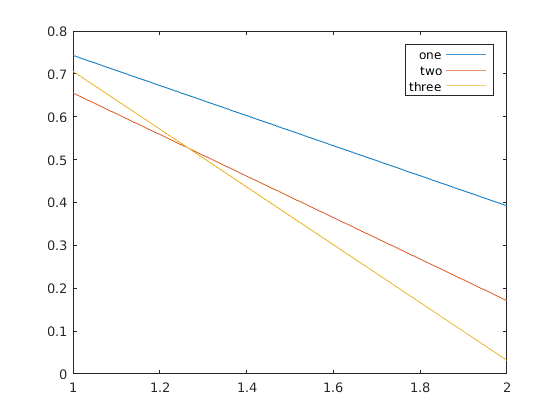
R2015b
![enter image description here]()

legendindeed does not cite an option to do this. I guess someone with HG2 knowledge would have to hack their way through MATLAB's underbelly. – Attemptlegend('left')directly, but to no avail. I would like to add that I use R2013b and that a solution working with HG1 would be nice too, even though I could request a newer version to my institute probably. – Duval