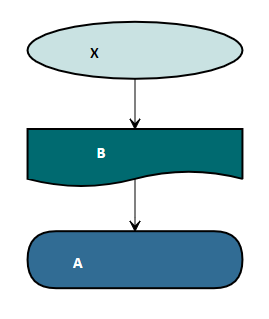
I have this graphML file, which was created with yworks yEd.
Now I want to read this file into R to plot it via visNetwork. But reading the file into R using the igraph::read_graph function fails:
library(igraph)
example <- igraph::read_graph("data/graphml_example.graphml", format = "graphml")
Warning messages:
1: In read.graph.graphml(file, ...) : At foreign-graphml.c:651 :Ignoring because of a missing or unknown 'attr.type' attribute
...
This is the graphml file:
<?xml version="1.0" encoding="UTF-8" standalone="no"?>
<!--Created by yFiles for HTML 2.0.1.4-->
<graphml xsi:schemaLocation="http://graphml.graphdrawing.org/xmlns http://www.yworks.com/xml/schema/graphml.html/2.0/ygraphml.xsd " xmlns="http://graphml.graphdrawing.org/xmlns" xmlns:demostyle="http://www.yworks.com/yFilesHTML/demos/FlatDemoStyle/1.0" xmlns:bpmn="http://www.yworks.com/xml/yfiles-for-html/bpmn/2.0" xmlns:demotablestyle="http://www.yworks.com/yFilesHTML/demos/FlatDemoTableStyle/1.0" xmlns:compat="http://www.yworks.com/xml/yfiles-compat-arrows/1.0" xmlns:VuejsNodeStyle="http://www.yworks.com/demos/yfiles-vuejs-node-style/1.0" xmlns:y="http://www.yworks.com/xml/yfiles-common/3.0" xmlns:x="http://www.yworks.com/xml/yfiles-common/markup/3.0" xmlns:yjs="http://www.yworks.com/xml/yfiles-for-html/2.0/xaml" xmlns:xsi="http://www.w3.org/2001/XMLSchema-instance">
    <key id="d0" for="node" attr.type="boolean" attr.name="Expanded" y:attr.uri="http://www.yworks.com/xml/yfiles-common/2.0/folding/Expanded">
        <default>true</default>
    </key>
    <key id="d1" for="node" attr.name="NodeLabels" y:attr.uri="http://www.yworks.com/xml/yfiles-common/2.0/NodeLabels"/>
    <key id="d2" for="node" attr.name="NodeGeometry" y:attr.uri="http://www.yworks.com/xml/yfiles-common/2.0/NodeGeometry"/>
    <key id="d3" for="all" attr.name="UserTags" y:attr.uri="http://www.yworks.com/xml/yfiles-common/2.0/UserTags"/>
    <key id="d4" for="node" attr.name="NodeStyle" y:attr.uri="http://www.yworks.com/xml/yfiles-common/2.0/NodeStyle"/>
    <key id="d5" for="node" attr.name="NodeViewState" y:attr.uri="http://www.yworks.com/xml/yfiles-common/2.0/folding/1.1/NodeViewState"/>
    <key id="d6" for="edge" attr.name="EdgeLabels" y:attr.uri="http://www.yworks.com/xml/yfiles-common/2.0/EdgeLabels"/>
    <key id="d7" for="edge" attr.name="EdgeGeometry" y:attr.uri="http://www.yworks.com/xml/yfiles-common/2.0/EdgeGeometry"/>
    <key id="d8" for="edge" attr.name="EdgeStyle" y:attr.uri="http://www.yworks.com/xml/yfiles-common/2.0/EdgeStyle"/>
    <key id="d9" for="edge" attr.name="EdgeViewState" y:attr.uri="http://www.yworks.com/xml/yfiles-common/2.0/folding/1.1/EdgeViewState"/>
    <key id="d10" for="port" attr.name="PortLocationParameter" y:attr.uri="http://www.yworks.com/xml/yfiles-common/2.0/PortLocationParameter">
        <default>
            <x:Static Member="y:FreeNodePortLocationModel.NodeCenterAnchored"/>
        </default>
    </key>
    <key id="d11" for="port" attr.name="PortStyle" y:attr.uri="http://www.yworks.com/xml/yfiles-common/2.0/PortStyle">
        <default>
            <x:Static Member="y:VoidPortStyle.Instance"/>
        </default>
    </key>
    <key id="d12" for="port" attr.name="PortViewState" y:attr.uri="http://www.yworks.com/xml/yfiles-common/2.0/folding/1.1/PortViewState"/>
    <key id="d13" attr.name="SharedData" y:attr.uri="http://www.yworks.com/xml/yfiles-common/2.0/SharedData"/>
    <data key="d13">
        <y:SharedData>
            <yjs:Color x:Key="1" value="#FF316C94"/>
            <yjs:Color x:Key="2" value="#FF006A70"/>
            <yjs:Color x:Key="3" value="#FFC9E2E2"/>
            <yjs:Arrow x:Key="4" type="NONE"/>
        </y:SharedData>
    </data>
    <graph id="G" edgedefault="directed">
        <node id="n0">
            <data key="d1">
                <x:List>
                    <y:Label>
                        <y:Label.Text>A</y:Label.Text>
                        <y:Label.LayoutParameter>
                            <y:RatioAnchoredLabelModelParameter LayoutOffset="45.2981354349738,20.5"/>
                        </y:Label.LayoutParameter>
                        <y:Label.Style>
                            <yjs:DefaultLabelStyle horizontalTextAlignment="CENTER" autoFlip="false" textFill="#FFFFFFFF" textSize="16">
                                <yjs:DefaultLabelStyle.font>
                                    <yjs:Font fontSize="16" fontFamily="Calibri" fontWeight="BOLD"/>
                                </yjs:DefaultLabelStyle.font>
                            </yjs:DefaultLabelStyle>
                        </y:Label.Style>
                    </y:Label>
                </x:List>
            </data>
            <data key="d2">
                <y:RectD X="1917.9576310558555" Y="2912.1062122893554" Width="214.8931458699476" Height="57"/>
            </data>
            <data key="d4">
                <demostyle:FlowchartNodeStyle type="terminator">
                    <demostyle:FlowchartNodeStyle.stroke>
                        <yjs:Stroke fill="#FF000000" miterLimit="1.45" thickness="2"/>
                    </demostyle:FlowchartNodeStyle.stroke>
                    <demostyle:FlowchartNodeStyle.fill>
                        <yjs:LinearGradient spreadMethod="PAD" startPoint="0,0" endPoint="1,1">
                            <yjs:GradientStop color="{y:GraphMLReference 1}" offset="0"/>
                            <yjs:GradientStop color="{y:GraphMLReference 1}" offset="1"/>
                        </yjs:LinearGradient>
                    </demostyle:FlowchartNodeStyle.fill>
                </demostyle:FlowchartNodeStyle>
            </data>
            <port name="p0"/>
        </node>
        <node id="n1">
            <data key="d1">
                <x:List>
                    <y:Label>
                        <y:Label.Text>B</y:Label.Text>
                        <y:Label.LayoutParameter>
                            <y:RatioAnchoredLabelModelParameter LayoutOffset="68.91532293497403,12.5"/>
                        </y:Label.LayoutParameter>
                        <y:Label.Style>
                            <yjs:DefaultLabelStyle horizontalTextAlignment="CENTER" autoFlip="false" textFill="#FFFFFFFF" textSize="16">
                                <yjs:DefaultLabelStyle.font>
                                    <yjs:Font fontSize="16" fontFamily="Calibri" fontWeight="BOLD"/>
                                </yjs:DefaultLabelStyle.font>
                            </yjs:DefaultLabelStyle>
                        </y:Label.Style>
                    </y:Label>
                </x:List>
            </data>
            <data key="d2">
                <y:RectD X="1917.9576310558555" Y="2809.9061759957385" Width="214.89314586994806" Height="57"/>
            </data>
            <data key="d4">
                <demostyle:FlowchartNodeStyle type="document">
                    <demostyle:FlowchartNodeStyle.stroke>
                        <yjs:Stroke fill="#FF000000" miterLimit="1.45" thickness="2"/>
                    </demostyle:FlowchartNodeStyle.stroke>
                    <demostyle:FlowchartNodeStyle.fill>
                        <yjs:LinearGradient spreadMethod="PAD" startPoint="0,0" endPoint="1,1">
                            <yjs:GradientStop color="{y:GraphMLReference 2}" offset="0"/>
                            <yjs:GradientStop color="{y:GraphMLReference 2}" offset="1"/>
                        </yjs:LinearGradient>
                    </demostyle:FlowchartNodeStyle.fill>
                </demostyle:FlowchartNodeStyle>
            </data>
            <port name="p0"/>
            <port name="p1"/>
            <port name="p2"/>
        </node>
        <node id="n2">
            <data key="d1">
                <x:List>
                    <y:Label>
                        <y:Label.Text>X</y:Label.Text>
                        <y:Label.LayoutParameter>
                            <y:RatioAnchoredLabelModelParameter LayoutOffset="62.41922918497403,20.5"/>
                        </y:Label.LayoutParameter>
                        <y:Label.Style>
                            <yjs:DefaultLabelStyle horizontalTextAlignment="CENTER" autoFlip="false" textFill="#FF000000" textSize="16">
                                <yjs:DefaultLabelStyle.font>
                                    <yjs:Font fontSize="16" fontFamily="Calibri" fontWeight="BOLD"/>
                                </yjs:DefaultLabelStyle.font>
                            </yjs:DefaultLabelStyle>
                        </y:Label.Style>
                    </y:Label>
                </x:List>
            </data>
            <data key="d2">
                <y:RectD X="1917.9576310558555" Y="2702.7061397021216" Width="214.89314586994806" Height="57"/>
            </data>
            <data key="d4">
                <demostyle:FlowchartNodeStyle type="start1">
                    <demostyle:FlowchartNodeStyle.stroke>
                        <yjs:Stroke fill="#FF000000" miterLimit="1.45" thickness="2"/>
                    </demostyle:FlowchartNodeStyle.stroke>
                    <demostyle:FlowchartNodeStyle.fill>
                        <yjs:LinearGradient spreadMethod="PAD" startPoint="0,0" endPoint="1,1">
                            <yjs:GradientStop color="{y:GraphMLReference 3}" offset="0"/>
                            <yjs:GradientStop color="{y:GraphMLReference 3}" offset="1"/>
                        </yjs:LinearGradient>
                    </demostyle:FlowchartNodeStyle.fill>
                </demostyle:FlowchartNodeStyle>
            </data>
            <port name="p0"/>
        </node>
        <edge id="e0" source="n1" target="n0" sourceport="p0" targetport="p0">
            <data key="d7">
                <x:List>
                    <y:Bend Location="2025.4042039908295,2898.850638702741"/>
                </x:List>
            </data>
            <data key="d8">
                <yjs:PolylineEdgeStyle sourceArrow="{y:GraphMLReference 4}">
                    <yjs:PolylineEdgeStyle.stroke>
                        <yjs:Stroke fill="#FF000000" miterLimit="1.45"/>
                    </yjs:PolylineEdgeStyle.stroke>
                    <yjs:PolylineEdgeStyle.targetArrow>
                        <yjs:Arrow stroke="#FF000000" fill="#FF000000"/>
                    </yjs:PolylineEdgeStyle.targetArrow>
                </yjs:PolylineEdgeStyle>
            </data>
        </edge>
        <edge id="e1" source="n2" target="n1" sourceport="p0" targetport="p2">
            <data key="d8">
                <yjs:PolylineEdgeStyle sourceArrow="{y:GraphMLReference 4}">
                    <yjs:PolylineEdgeStyle.stroke>
                        <yjs:Stroke fill="#FF000000" miterLimit="1.45"/>
                    </yjs:PolylineEdgeStyle.stroke>
                    <yjs:PolylineEdgeStyle.targetArrow>
                        <yjs:Arrow stroke="#FF000000" fill="#FF000000"/>
                    </yjs:PolylineEdgeStyle.targetArrow>
                </yjs:PolylineEdgeStyle>
            </data>
        </edge>
    </graph>
</graphml>
How can I read this into R so that properties like shape and color are preserved?

