Implementing smooth colouring in mandelbrot set
Asked Answered
O

1

7

I am trying to colour MandelBrot using HSV values and the PIL Library.

Even after multiple tries fiddling with HSV values, I could not achieve the desired effect.

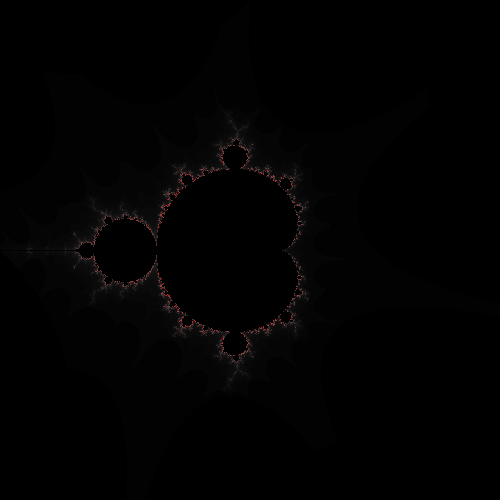
here is what I currently have

Current.png

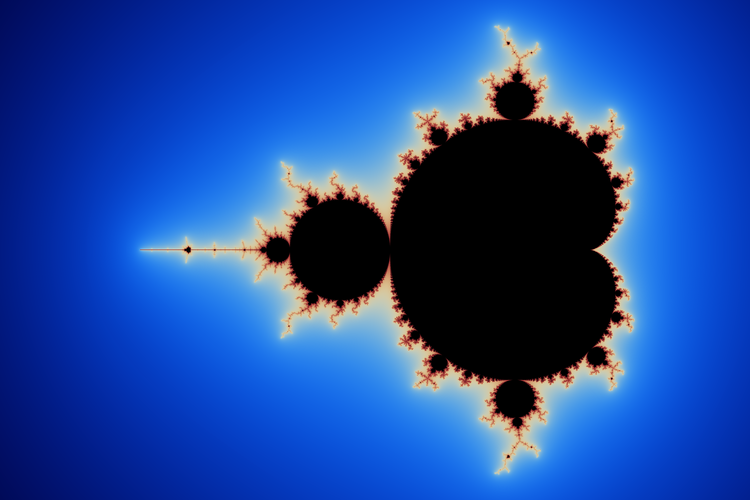
Here is the desired effect

Desired.png

This is the code that I am trying, It could also be beneficial if you could add some tips to optimise the below code to compute the set faster, I am new to python

from PIL import Image
import random
import math
from decimal import Decimal


# Size of the Image Canvas
HEIGHT = 500

ZOOM = 0.0
Y_PAN = 0.0


# Range of the Complex Plane
MIN_X = -2.0 + ZOOM
MAX_X = 2.0 - ZOOM


MAX_Y = 2.0 + Y_PAN - ZOOM
MIN_Y = -2.0 + Y_PAN + ZOOM

DATA = []


def map_to_scale_d(x, in_min, in_max, out_min, out_max):
    # returns float
    return float((x - in_min) * (out_max - out_min) / (in_max - in_min) + out_min)


def map_to_scale(x, in_min, in_max, out_min, out_max):
    # returns int
    return (x - in_min) * (out_max - out_min) / (in_max - in_min) + out_min


# Max iterations till Zn
ITER = 200

# loop to traverse every single point in Canvas
for y in xrange(HEIGHT):
    for x in xrange(HEIGHT):

        # convert to complex plane scale
        a = map_to_scale_d(x, 0, HEIGHT, MIN_X, MAX_X)
        b = map_to_scale_d(y, 0, HEIGHT, MAX_Y, MIN_Y)

        # original values
        _a = a  
        _b = b  

        counter = 0
        # start the iteration at (a,b) in complex plane
        # calculate z^2 + c
        while(counter < ITER):

            aa = a * a - b * b
            bb = 2 * a * b

            a = aa + _a
            b = bb + _b

            if((abs(aa + bb)) > 4):
                break

            counter = counter + 1

        # initialise color
        h = 0
        s = map_to_scale(counter, 0, ITER, 0, 100)
        v = map_to_scale(counter, 0, ITER, 0, 100)

        if(counter == ITER):
            h = 0
            s = 0
            v = 0

        # convert to 8-bit
        h = map_to_scale(h, 0, 360, 0, 255)
        s = map_to_scale(s, 0, 100, 0, 255)
        v = map_to_scale(v, 0, 100, 0, 255)

        DATA.append((h, s, v))

img = Image.new('HSV', (HEIGHT, HEIGHT))

img.putdata(DATA)
img.show()
img.convert('RGB').save('test.png')
Oyster answered 10/3, 2018 at 18:54 Comment(3)
IMO the best way to compute the colour is to precalculate an array (or arrays) which are indexed by the number of iterations. As for speed, I don't know how much Python optimises but one gain could be to move b = map_to_scale_d(y, 0, HEIGHT, MAX_Y, MIN_Y) outside of the x loop and of course, not modifying b. Every little helps, but the iteration is the major bottleneck. If your code is interpreted it won't perform as well as native code.Tacye
stackoverflow.com/questions/369438 and en.wikipedia.org/wiki/Mandelbrot_set#Computer_drawingsBoise
see almost duplicate Can't find a way to color the Mandelbrot-set the way i'm aiming forHooligan
B
0

This is a great article on drawing Mandelbrot set in Python that describes the process in great detail. The basic idea is that color will be black when Mandelbrot set is stable, and the Hue and Saturation will depend on the stability value when it is less then 1.

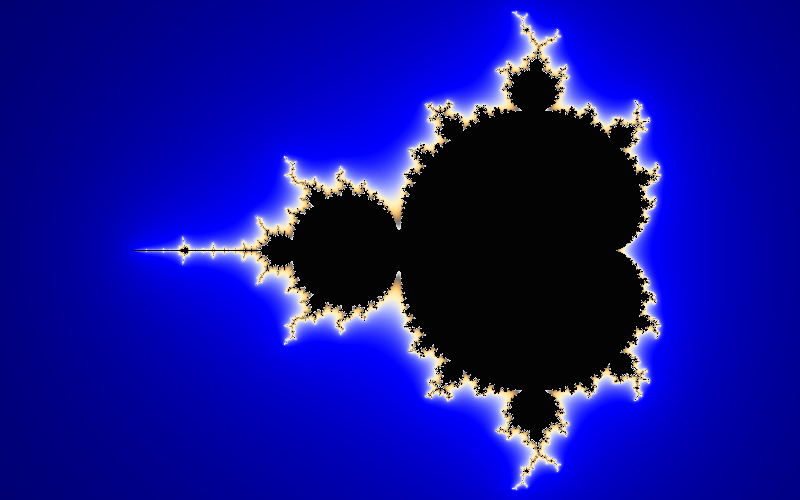
Following their instructions you can get following:

enter image description here

And here is the code:

from dataclasses import dataclass
from math import log
from PIL import Image
import numpy as np
from scipy.interpolate import interp1d

        
@dataclass
class Viewport:
    image: Image.Image
    center: complex
    width: float

    @property
    def height(self):
        return self.scale * self.image.height

    @property
    def offset(self):
        return self.center + complex(-self.width, self.height) / 2

    @property
    def scale(self):
        return self.width / self.image.width

    def __iter__(self):
        for y in range(self.image.height):
            for x in range(self.image.width):
                yield Pixel(self, x, y)

@dataclass
class Pixel:
    viewport: Viewport
    x: int
    y: int

    @property
    def color(self):
        return self.viewport.image.getpixel((self.x, self.y))

    @color.setter
    def color(self, value):
        self.viewport.image.putpixel((self.x, self.y), value)

    def __complex__(self):
        return (
                complex(self.x, -self.y)
                * self.viewport.scale
                + self.viewport.offset
        )

@dataclass
class MandelbrotSet:
    max_iterations: int
    escape_radius: float = 2.0

    def __contains__(self, c: complex):
        return self.stability(c) == 1

    def stability(self, c: complex, smooth=False, clamp=True):
        value = self.escape_count(c, smooth) / self.max_iterations
        return max(0.0, min(value, 1.0)) if clamp else value

    def escape_count(self, c: complex, smooth=False):
        z = 0
        for iteration in range(self.max_iterations):
            z = z ** 2 + c
            if abs(z) > self.escape_radius:
                if smooth:
                    return iteration + 1 - log(log(abs(z))) / log(2)
                return iteration
        return self.max_iterations
    

def paint(mandelbrot_set, viewport, palette, smooth):
    for pixel in viewport:
        stability = mandelbrot_set.stability(complex(pixel), smooth)
        index = int(min(stability * len(palette), len(palette) - 1))
        pixel.color = palette[index % len(palette)]
        
def denormalize(palette):
    return [
        tuple(int(channel * 255) for channel in color)
        for color in palette
    ]
    
def make_gradient(colors, interpolation="linear"):
    X = [i / (len(colors) - 1) for i in range(len(colors))]
    Y = [[color[i] for color in colors] for i in range(3)]
    channels = [interp1d(X, y, kind=interpolation) for y in Y]
    return lambda x: [np.clip(channel(x), 0, 1) for channel in channels]
        
        
black = (0, 0, 0)
blue = (0, 0, 1)
brick = (0.9, 0.7, 0.4)
navy = (0, 0, 0.2)
red = (1, 0, 0)
light_gray = (0.9,0.9,0.9)       
gray = (0.5, 0.5, 0.5) 

num_colors = 1024
colors = [ navy, blue, light_gray, brick, gray, light_gray, black]
gradient = make_gradient(colors, interpolation="cubic")
palette = denormalize([
    gradient(i / num_colors) for i in range(num_colors)
])

image = Image.new(mode="RGB", size=(800, 500))
mandelbrot_set = MandelbrotSet(max_iterations=35,  escape_radius=1000)
viewport = Viewport(image, center=-0.75, width=3.75)
paint(mandelbrot_set, viewport, palette,  smooth=True)
image.show()
Bechance answered 21/8, 2023 at 10:39 Comment(2)
Could you please expand on iteration + 1 - log(log(abs(z))) / log(2)?Bandur
This addition is called "normalized iteration count". It is needed to get less spurious results. You can read in-depth explanation hereBechance

© 2022 - 2024 — McMap. All rights reserved.