Explanation
The contourc function does not change your data. It just plots them. Using the VN argument you can control how many contour lines are created between the highest and lowest point of the topography/function you are plotting.
If you set VN to a scalar integer value, it directly specifies the number of lines. VN=20 will create 20 levels between the highest and lowest point of your topography.
If you specify a vector of values you can exactly control at which values in your data the contour line is produced. You should take care that the values are in between min(data(:)) and max(data(:)). Otherwise the lines will not be drawn. Example VN=linspace(min(data(:)),max(data(:)),10) will create the exact same contour lines as not specifying VN.
Examples
To illustrate the effect of VN parameter I give some examples here. I use the contour function to directly plot the lines instead of just calculating them with contourcbut the effect is the same.
% Create coordinate grid
[x,y]=meshgrid(-2:0.1:2,-2:0.1:2);
% define a contour function
z=x.^2 + 2*y.^3;
% create a figure
figure();
% plot contour
contour(x,y,z);
% make axis iso scaled
axis equal
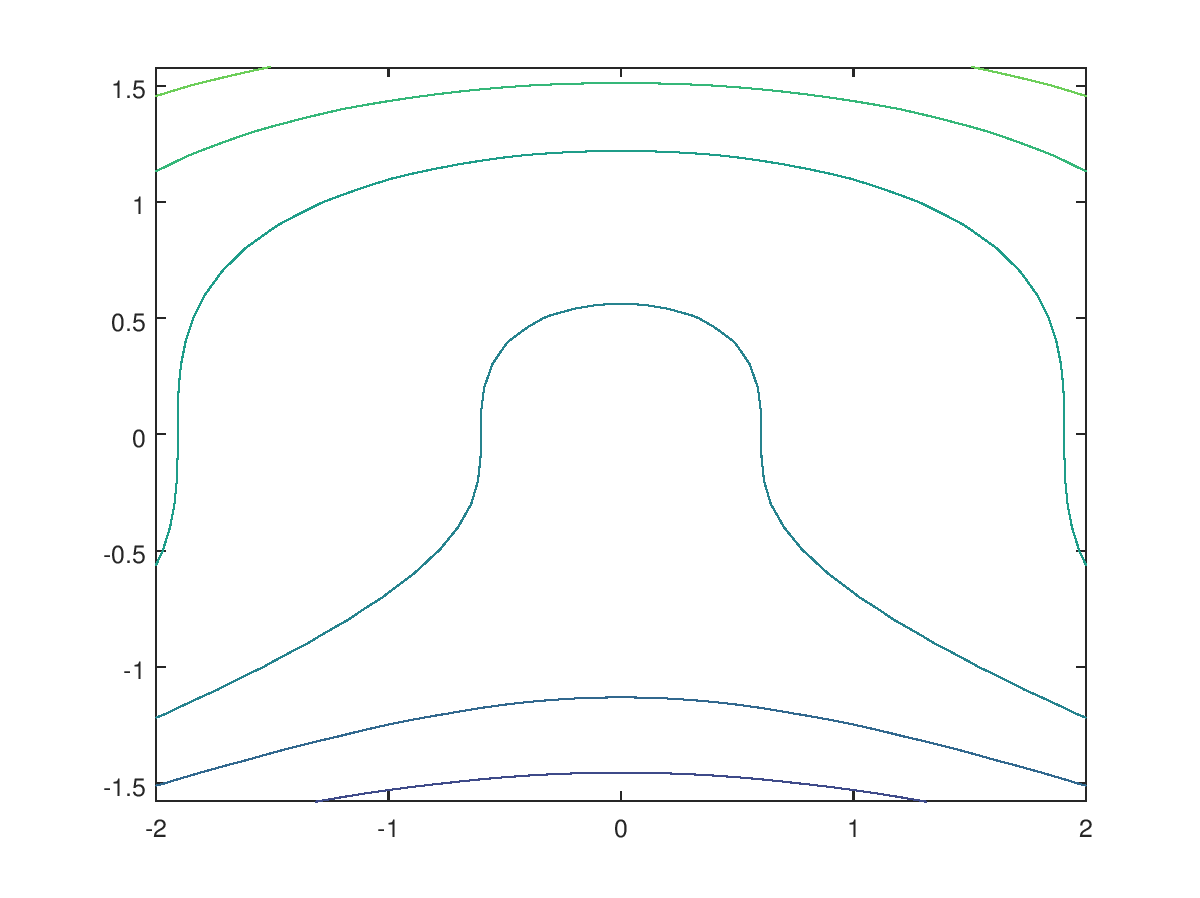
Example 1
Using the contour command without VN argument produces the following result
contour(x,y,z);
![<code>contour(x,y,z)</code>]()
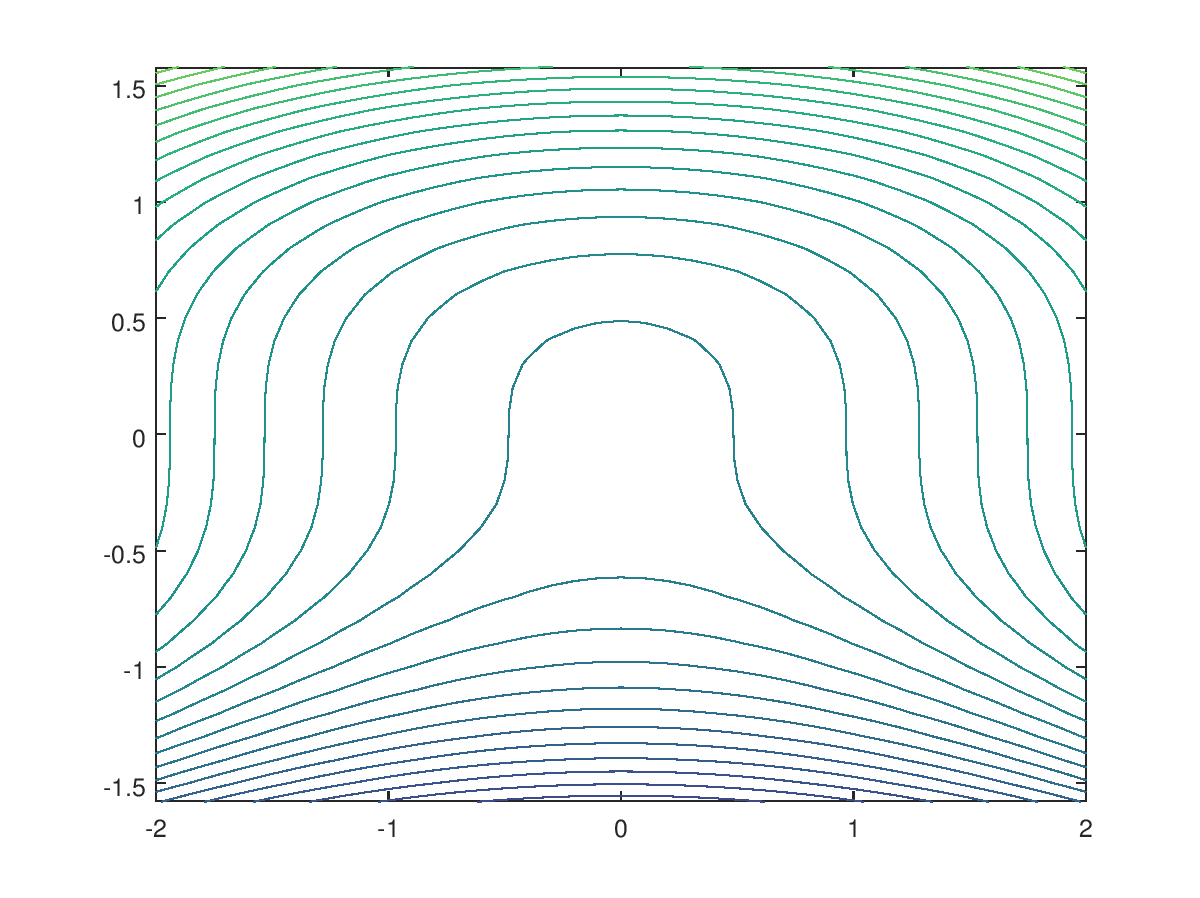
Example 2: VN=50
Setting VN to 50
contour(x,y,z,50);
![<code>contour(x,y,z,50)</code>]()
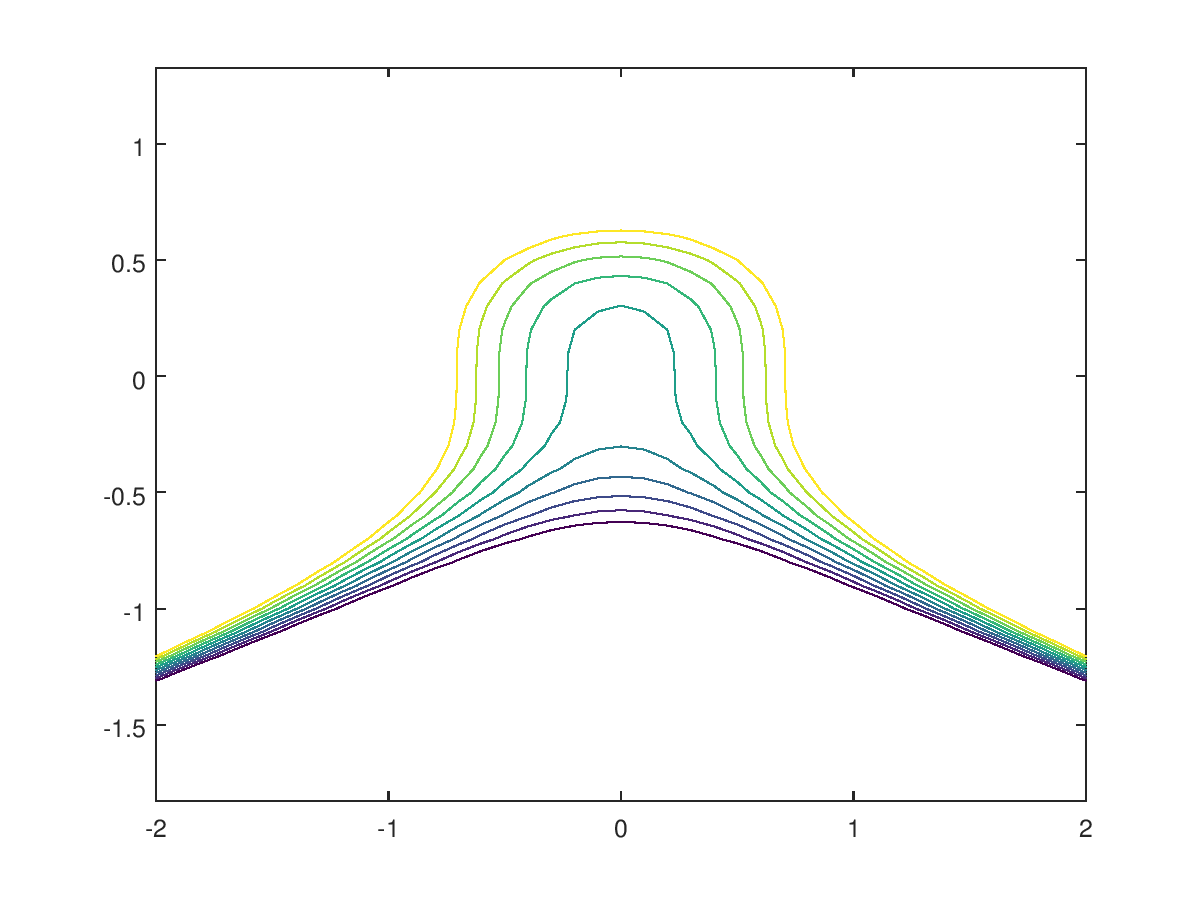
Example 3: VN= vector
Setting VN explicitly to the contour values vector is used here to limit contour lines to a rather narrow range of z data:
contour(x,y,z,linspace(-0.5,0.5,10));
![<code>contour(x,y,z,linspace(-0.5,0.5,10))</code>]()


