How should I format across rows of a gt table efficiently in R?
Asked Answered
V

2

7

If I want to efficiently format rows of a gt table, is there a better method than what I have shown below.

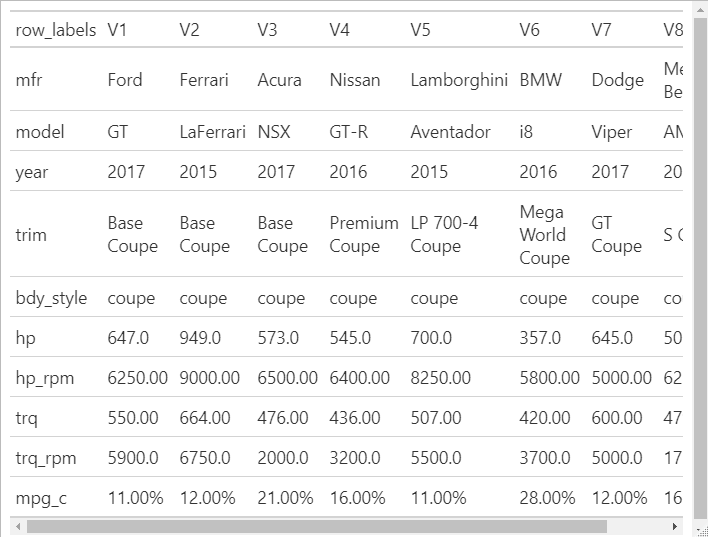
Some rows are character, and so need no formatting, some are numbers where one decimal place is required, some are numbers where two decimal places is required, and some are percentages where two decimal places is required. Whatever is done, should ideally generalise to other possible formats.

I create a data frame that creates the specification for formatting, but each format requires a separate command in the pipe.

library(dplyr)
library(gt)

#create small dataset
gtcars_8 <-
  gtcars %>%
  dplyr::group_by(ctry_origin) %>%
  dplyr::top_n(2) %>%
  dplyr::ungroup() %>%
  dplyr::filter(ctry_origin != "United Kingdom")

#transpose data
row_labels <- colnames(gtcars_8)
gtcars_8_t <- as.data.frame(t(as.matrix(gtcars_8)))
gtcars_8_t$row_labels <- row_labels
my_column_names <- colnames(gtcars_8_t)[1:8]

#format data
format_specs <- as.data.frame(row_labels[1:10])
format_specs$type     <- c("c","c","n","c","c","n","n","n","n","p")
format_specs$decimals <- c( 0 , 0 , 0 , 0 , 0 , 1 , 2 , 2 , 1 , 2 )
format_specs

#make basic gt table
gtcars_8_t %>%
  slice(1:10) %>% 
  gt()

#make gt table with formats hardcoded (desired output)
gtcars_8_t %>%
  slice(1:10) %>% 
  gt() %>% 
  cols_move_to_start("row_labels") %>% 
  #format for rows where: type = n, and decimals = 1
  fmt(columns = vars(my_column_names),
      rows = which(format_specs$type  == "n" & format_specs$decimals == 1 ), 
      fns = function(x) { 
        formatC(as.numeric(x), digits = 1, format = "f")
      } ) %>% 
  #format for rows where: type = n, and decimals = 2
  fmt(columns = vars(my_column_names),
      rows = which(format_specs$type  == "n" & format_specs$decimals == 2 ), 
      fns = function(x) { 
        formatC(as.numeric(x), digits = 2, format = "f")
      } ) %>% 
  #format for rows where: type = p, and decimals = 2
  fmt(columns = vars(my_column_names),
      rows = which(format_specs$type  == "p" & format_specs$decimals == 2 ), 
      fns = function(x) { 
        paste0(formatC(as.numeric(x), digits = 2, format = "f"),"%")
      } ) 

result

While not quite the same, applying formatting in gt appears to be a bit trickier than one might first expect ( eg).

Vento answered 12/6, 2020 at 5:39 Comment(0)
S
4

A generalisable approach to achieve this is to set up a wrapper which loops through the format_specs dataframe and applies the format rules row by row. For the looping part I make use of purrr::reduce but a simple for-loop should also work:

library(dplyr)
library(purrr)
library(gt)

#create small dataset
gtcars_8 <-
  gtcars %>%
  dplyr::group_by(ctry_origin) %>%
  dplyr::top_n(2) %>%
  dplyr::ungroup() %>%
  dplyr::filter(ctry_origin != "United Kingdom")
#> Selecting by msrp

#transpose data
row_labels <- colnames(gtcars_8)
gtcars_8_t <- as.data.frame(t(as.matrix(gtcars_8)))
gtcars_8_t$row_labels <- row_labels
my_column_names <- colnames(gtcars_8_t)[1:8]

#format data

format_specs <- data.frame(row = row_labels[1:10]) # Name column with row labels
format_specs$type     <- c("c","c","n","c","c","n","n","n","n","p")
format_specs$decimals <- c( 0 , 0 , 0 , 0 , 0 , 1 , 2 , 2 , 1 , 2 )

myfmt <- function(data, cols, row_spec) {
  reduce(row_spec$row, function(x, y) {
    row_spec <- filter(row_spec, row == y)
    fmt(x, columns = cols,
        rows = which(x[["_data"]][["row_labels"]] == y), 
        fns = function(x) switch(row_spec$type,
                                 n = scales::number(as.numeric(x), accuracy = 10^(-row_spec$decimals), big.mark = ""),
                                 p = scales::percent(as.numeric(x), scale = 1, accuracy = 10^(-row_spec$decimals))))
        }, .init = data)
}

gtcars_8_t %>%
  slice(1:10) %>% 
  gt() %>% 
  cols_move_to_start("row_labels") %>% 
  myfmt(vars(my_column_names), format_specs)

Created on 2020-06-12 by the reprex package (v0.3.0)

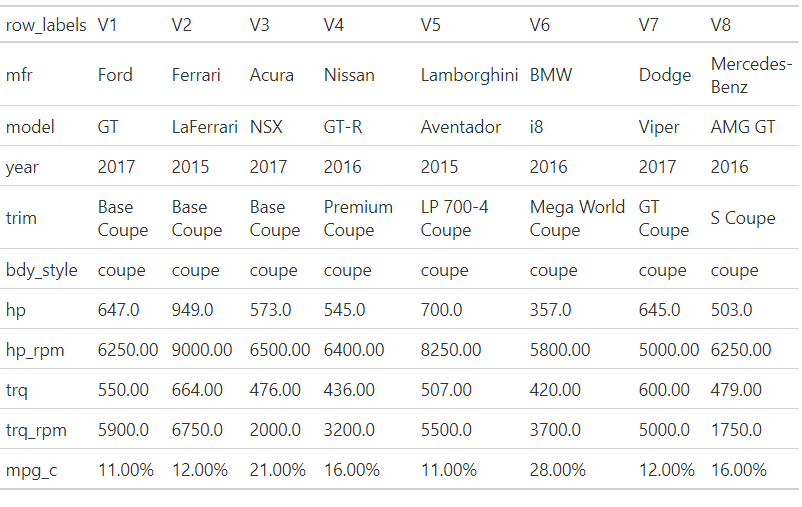
Results in this table:

enter image description here

Sheley answered 12/6, 2020 at 14:0 Comment(1)
I did have a go at a for loop approach and ended up with ‘i’ tables, each of which had one format correct. That was the trigger to start a stack overflow question, which you solved, cheers.Vento
U
0

Got this in a couple less lines.

library(tidyverse)
library(scales)
library(gt)


#create small dataset
gtcars_8 <-
  gtcars %>%
  dplyr::group_by(ctry_origin) %>%
  dplyr::top_n(2) %>%
  dplyr::ungroup() %>%
  dplyr::filter(ctry_origin != "United Kingdom")
#> Selecting by msrp


gtcars_8 %>% 
  rownames_to_column() %>%
  #mutate(hp_rpm = scales::number(hp_rpm)) %>% example formatting change
  mutate_all(as.character) %>% 
  pivot_longer(-rowname)  %>%
  pivot_wider(names_from = rowname) %>% 
  gt()
Ulises answered 23/11, 2020 at 17:36 Comment(0)

© 2022 - 2024 — McMap. All rights reserved.