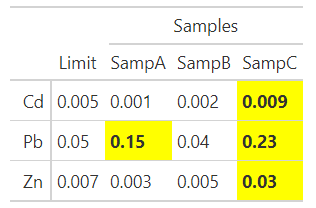
This is my first post, so apologies if I messed something up. I am trying to apply conditional formatting to multiple columns (comparing results for samples SampA, SampB and SampB to Limit) of a gt table. Following the lead of one of the gt examples and a different stack overflow Q, I have managed to apply it to a single column (variable) using this code:
## Conditional Formatting of single column in gt table

samples = as_tibble(cbind("Chem"=c("Cd","Pb","Zn"),
                       "Limit"=c("0.005","0.05","0.007"),
                       "SampA" = c("0.001","0.15","0.003"),
                       "SampB" = c("0.002","0.04","0.005"),
                       "SampC" = c("0.009","0.23","0.03")))

gt(samples,rowname_col="Chem") %>% tab_style(
        style = list(
                cell_fill(color = "grey80"),
                cell_text(weight = "bold")
        ),
        locations = cells_body(
                columns = vars(SampA),
                rows = SampA >= Limit
        )
    )   %>% tab_spanner(
            label = "Samples",
            columns = vars(SampA,SampB,SampC))

However, I have not been successful in trying to expand this to multiple columns. I can get the 'columns' argument to work with 'vars(SampA,SampB,SampC)'. Leaving the 'rows' argument with 'SampA >= Limit', the formatting 'works' in the sense that all rows where SampA >= Limit are highlighted across the three Samp columns, but this is not what I'm after. Running the code below ends up with no formatting of any column.
        locations = cells_body(
                columns = vars(SampA,SampB,SampC),
                rows = vars(SampA,SampB,SampC) >= Limit
        )

I have been able to "brute force" what I'm after by repeating the 'style_tab()' tailored to each column, but know that there must be a better way to get to my goal. Help?


