Efficiently match point to geometry (point in poly) for large collections of both points and polygons
Asked Answered
V

3

7

There are a lot of questions here about matching points in polygons efficiently (examples: Here and Here). The primary variables of interest in these are high number of points N, and number of polygon vertices V. These are all good and useful, but I am looking at a high number of points N and polygons G. This also means that my output will be different (I've primarily seen output consisting of the points that fall inside a polygon, but here I'd like to know the polygon attached to a point).

I have a shapefile with a large number of polygons (hundreds of thousands). Polygons can touch, but there is little to no overlap between them (any overlap of interiors would be a result of error - think census block groups). I also have a csv with points (millions), and I would like to categorize those points by which polygon the point falls in, if any. Some may not fall into a polygon (continuing with my example, think points over the ocean). Below I set up a toy example to look at the issue.

Setup:

import numpy as np
from shapely.geometry import shape, MultiPolygon, Point, Polygon
import geopandas as gpd
import pandas as pd
import matplotlib.pyplot as plt
from shapely.strtree import STRtree

#setup:
np.random.seed(12345)

# shape gridsize:
gridsize=10
avgpointspergridspace=10 #point density

Creating a geodataframe of polygons (simulating a shapefile imported using geopandas):

# creating a geodataframe (shapefile imported via geopandas):
garr=np.empty((gridsize,gridsize),dtype=object)
for i in range(gridsize):
    for j in range(gridsize):
        garr[i,j]=Point(i,j)

# polygons:
poly_list=[]
for i in range(gridsize-1):
    for j in range(gridsize-1):
        temp_points=[garr[i,j],garr[i,j+1],garr[i+1,j+1],garr[i+1,j],garr[i,j]]
        poly=Polygon([[p.x,p.y] for p in temp_points])
        poly_list+=[poly]

# creating a geodataframe, including some additional numeric and string variables:
gdf=gpd.GeoDataFrame()
gdf['geometry']= poly_list
gdf['id']=list(range(len(gdf['geometry'])))
gdf['numeric']=0
gdf['string']='foo'

# creating some holes in the grid:
gdf['included']=[np.random.choice([True,False],p=[.95,.05]) for x in range(len(gdf))]
gdf_polys=gdf[gdf['included']]

Generating points (simulating a csv imported via pandas):

# creating a pandas dataframe with points (csv of coordinates imported to pandas):
npoints=(gridsize+2)**2*10
fgridend=gridsize+1
fgridstart=-1

xlist=[]
ylist=[]
points=[]
for i in range(npoints):
    x=fgridstart+np.random.random()*fgridend
    y=fgridstart+np.random.random()*fgridend
    xlist+=[x]
    ylist+=[y]

df=pd.DataFrame(list(zip(xlist,ylist)),columns=['x','y'])

coords=[Point(xy) for xy in zip(df['x'],df['y'])]

gdf_points=gpd.GeoDataFrame(df,geometry=coords)

Plotting the results:

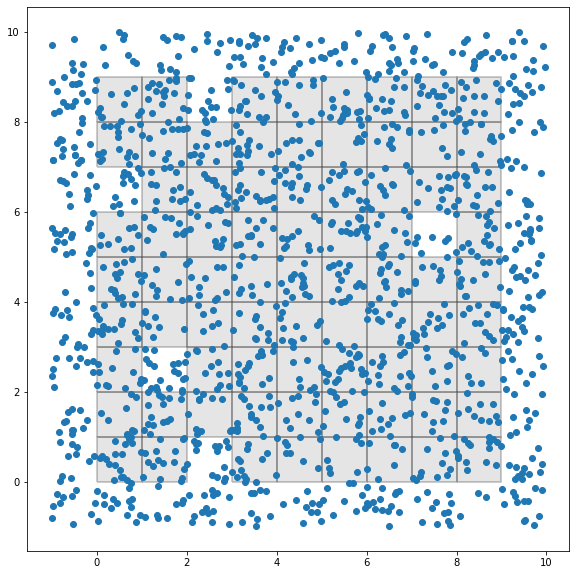
fig, ax = plt.subplots(figsize=[10,10])
gdf_polys.plot(ax=ax,facecolor='gray',alpha=.2,edgecolor='black',lw=2)
gdf_points.plot(ax=ax)

Returns:

Plot of points and polygons

I now want to match points with the polygons. So The desired output would be an additional column in gdf_points with an identifier for which polygon the point is associated with (using the gdf_polys['id'] column). My very slow code, which produces the correct result is below:

def id_gen(row):
    point=row['geometry']
    out=0
    for i,poly in shapes_list:
        if poly.contains(point):
            out=i
            break
    return out
        
#shapes_list=gdf_polys['geometry']
shapes_list=[(gdf_polys['id'].iloc[i],gdf_polys['geometry'].iloc[i]) for i in range(len(gdf_polys['geometry']))]
point_list=[]
gdf_points['poly']=gdf_points.apply(id_gen,axis=1)

which returns:

    x   y   geometry    poly
0   4.865555    1.777419    POINT (4.86555 1.77742) 37
1   6.929483    3.041826    POINT (6.92948 3.04183) 57
2   4.485133    1.492326    POINT (4.48513 1.49233) 37
3   2.889222    6.159370    POINT (2.88922 6.15937) 24
4   2.442262    7.456090    POINT (2.44226 7.45609) 25
... ... ... ... ...
1435    6.414556    5.254309    POINT (6.41456 5.25431) 59
1436    6.409027    4.454615    POINT (6.40903 4.45461) 58
1437    5.763154    2.770337    POINT (5.76315 2.77034) 47
1438    9.613874    1.371165    POINT (9.61387 1.37116) 0
1439    6.013953    3.622011    POINT (6.01395 3.62201) 57
1440 rows × 4 columns

I should note that actual shapefiles will have much more complicated shapes than this grid. I think there are a few places that this could be sped up:

  1. Not having to loop over every polygon (this will get unwieldy as P increases)
  2. Using a different algorithm for the point-in-poly. I feel like there should be a way to use STRtree to do this, but currently I've only been able to return the points (and not the indices).
  3. Vectorize dataframe operations (avoiding apply).
  4. Probably something else not on my radar (parallelization or something else)

Beginning benchmarking: With a grid size of 10, point density of 10 (1440 points): took about 180ms With a grid size of 20, point density of 10 (4840 points): took about 2.8s With a grid size of 30, point density of 10 (10240 points): took about 12.8s With a grid size of 50, point density of 10 (27040 points): took about 1.5 mins So we can see this scales poorly.

Valletta answered 19/4, 2021 at 22:33 Comment(0)
V
3

Rather than thinking about this as a mass point-in-poly, geopandas has a spatial-join method that is useful here. It's actually quite fast, and at least with this toy example doesn't appear to be all that affected by the number of polygons (I can't rule out that this might be due to the simplicity of these polygons though).

Spatial join takes two geodataframes and merges them together. In this case, I want the properties of the polygons attached to the points that lie within. So my code looks like this:

joined=gpd.sjoin(gdf_points,gdf_polys,how='left',op='within')

Returns:

    x   y   geometry    poly    index_right id  numeric string  included
0   18.651358   26.920261   POINT (18.65136 26.92026)   908 908.0   908.0   0.0 foo True
1   38.577101   1.505424    POINT (38.57710 1.50542)    1863    1863.0  1863.0  0.0 foo True
2   15.430436   15.543219   POINT (15.43044 15.54322)   750 750.0   750.0   0.0 foo True
3   44.928141   7.726345    POINT (44.92814 7.72635)    2163    2163.0  2163.0  0.0 foo True
4   34.259632   5.373809    POINT (34.25963 5.37381)    1671    1671.0  1671.0  0.0 foo True
... ... ... ... ... ... ... ... ... ...
27035   32.386086   23.440186   POINT (32.38609 23.44019)   1591    1591.0  1591.0  0.0 foo True
27036   7.569414    1.836633    POINT (7.56941 1.83663) 344 344.0   344.0   0.0 foo True
27037   1.141440    34.739388   POINT (1.14144 34.73939)    83  83.0    83.0    0.0 foo True
27038   -0.770784   14.027607   POINT (-0.77078 14.02761)   0   NaN NaN NaN NaN NaN
27039   12.695803   33.405048   POINT (12.69580 33.40505)   621 621.0   621.0   0.0 foo True

This was very fast compared to my initial code. Running the largest size I tested (27k points) took under 60ms (compare to 1.5 mins for the previous code). Scaling up to some of my actual work, 1mil points took just over 13 seconds to match into just under 200k polygons, most of which were much more complex than the geometries used in my toy example. This seems like a manageable method, but I'd be interested in learning ways to improve the efficiency further.

Valletta answered 20/4, 2021 at 17:38 Comment(0)
C
1

It sounds like you could avoid iterating through all polygons by using the nearest STRtree algorithm, as written in the documentation (along with note above about recovering indices of the polygons) - and checking if the point sits within the nearest polygon. I.e. something like

from shapely.strtree import STRtree
#... coords is the list of shapely points and poly_list is the list of polygons ...
#to recover the polygon id, use their unique python id.
poly_id = dict((id(poly), i) for i, poly in enumerate(poly_list))
#form stretree of polygons
poly_tree = STRtree(poly_list)
pt_to_id = []
#fill pt_to_id with the nearest polygon if it contains the given point. If the point is within no polygon write None.
for c in coords:
    near = poly_tree.nearest(c)
    if near.contains(c):
        pt_to_id.append(poly_id[id(near)])
    else:
        pt_to_id.append(None) 
Catoptrics answered 20/4, 2021 at 14:45 Comment(0)
T
0

Using inspiration from other answers here and on other threads, the solution that worked best for me for very large sets of points (billions) and polygons that may span large areas, was a combination of geopandas.sjoin and slicing up the data into sections, borrowing an implementation from the osmnx library.

The idea is to slice up each polygon into regular shapes so that sjoin can conduct the lookup much more efficiently with a bounding box.

import math
import numpy as np
from shapely.geometry import MultiPolygon, LineString
from shapely.ops import split
import geopandas as gp

def quadrat_cut_geometry(geometry, quadrat_width, min_num=1):
    """
    Split a Polygon or MultiPolygon up into sub-polygons of a specified size.
    Parameters
    ----------
    geometry : shapely.geometry.Polygon or shapely.geometry.MultiPolygon
        the geometry to split up into smaller sub-polygons
    quadrat_width : numeric
        the linear width of the quadrats with which to cut up the geometry (in
        the units the geometry is in)
    min_num : int
        the minimum number of linear quadrat lines (e.g., min_num=3 would
        produce a quadrat grid of 4 squares)
    Returns
    -------
    geometry : shapely.geometry.MultiPolygon
    """
    # create n evenly spaced points between the min and max x and y bounds
    west, south, east, north = geometry.bounds
    x_num = math.ceil((east - west) / quadrat_width) + 1
    y_num = math.ceil((north - south) / quadrat_width) + 1
    x_points = np.linspace(west, east, num=max(x_num, min_num))
    y_points = np.linspace(south, north, num=max(y_num, min_num))

    # create a quadrat grid of lines at each of the evenly spaced points
    vertical_lines = [LineString([(x, y_points[0]), (x, y_points[-1])]) for x in x_points]
    horizont_lines = [LineString([(x_points[0], y), (x_points[-1], y)]) for y in y_points]
    lines = vertical_lines + horizont_lines

    # recursively split the geometry by each quadrat line
    for line in lines:
        geometry = MultiPolygon(split(geometry, line))

    return geometry


def assign_region(points, polygons, region_name):
    """
    Assigns region definitions to a GeoDataFrame of points.
    Parameters
    ----------
    points : geopandas.GeoDataFrame
        Input data that contains a geometry field with the point locations
    polygons : geopandas.GeoDataFrame
        Polygon data for each region to be matched
    region_name : str
        Name of the column in the polygons GeoDataFrame that contains the 
        region name which will be assigned to the points data
    Returns
    -------
    geopandas.GeoDataFrame
    """
    cut_polygons = []
    for region, poly in polygons.set_index(region_name)['geometry'].iteritems():
        cut_geom = quadrat_cut_geometry(poly, 0.1)
        cut_geom = [{region_name: region, 'geometry': geom.buffer(1e-14).buffer(0)} for geom in cut_geom]
        cut_polygons.extend(cut_geom)
    cut_polygons = gp.GeoDataFrame(cut_polygons)
    merged = gp.sjoin(points, cut_polygons, how='inner', op='within')
    return merged

To use, simply pass a GeoDataFrame containing the polygons and another containing the points to the assign_region function. This will return the points DataFrame with a new column containing an identifier column from the polygon DataFrame.

Tonyatonye answered 18/8, 2023 at 13:19 Comment(0)

© 2022 - 2024 — McMap. All rights reserved.