Using Gaussian Mixture for 1D array in python sklearn
Asked Answered
D

1

7

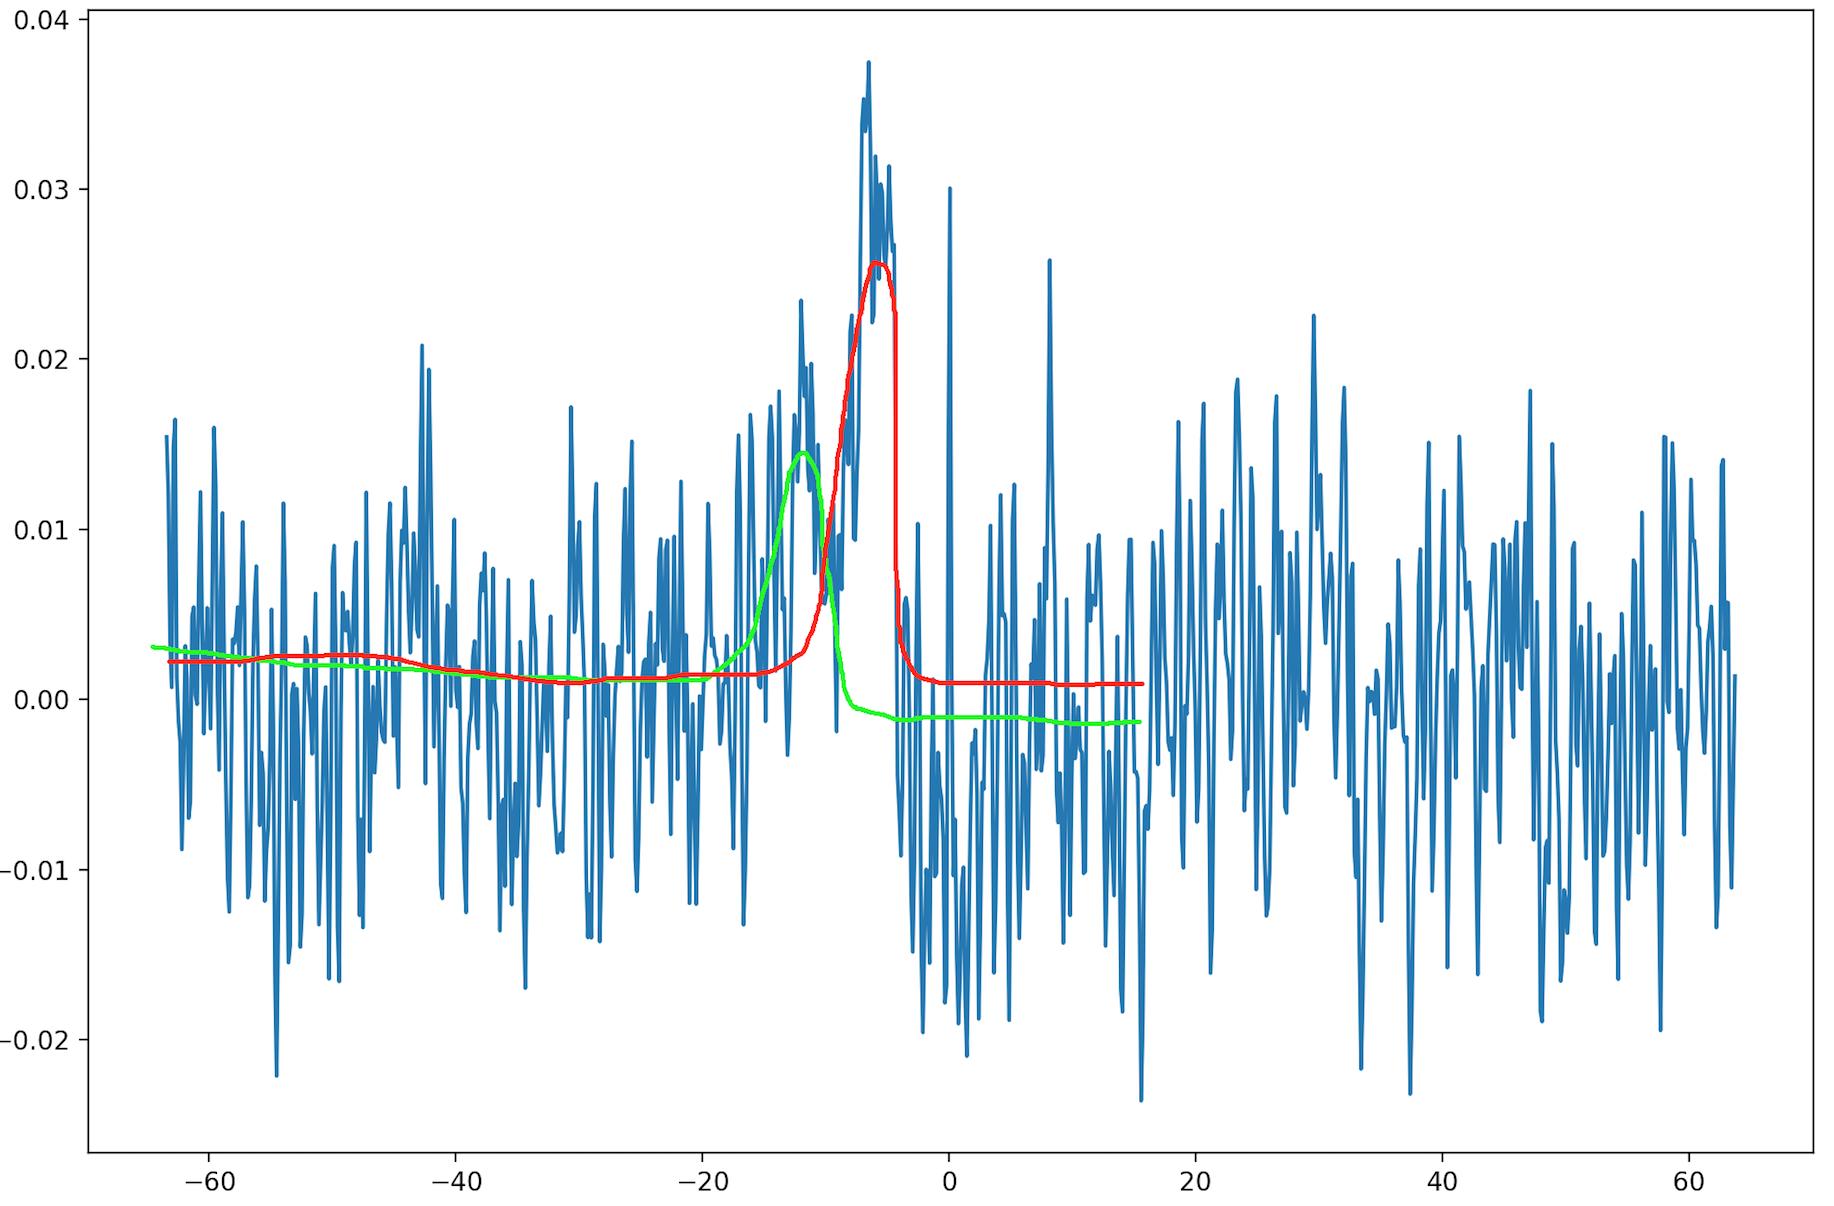
I would like to use a Gaussian mixture model to return something like the image below except proper Gaussians.

I'm attempting to use python sklearn.mixture.GaussianMixture but I have failed. I can treat each peak as though it were the height of a histogram for any given x value. My question is: do I have to find a way to transform this graph into a histogram and remove the negative values, or is there a way to apply GMM directly onto this array to produce the red and green gaussians?

enter image description here

Dionne answered 2/8, 2018 at 21:34 Comment(2)
A 1-d gaussian mixture example can be found here: astroml.org/book_figures/chapter4/fig_GMM_1D.htmlSatiny
The solution posted below requires that you know how many gaussians are present and in general, you need to have a reasonable initial guess for the parameters. And, It easily becomes unstable in examples such as you provide in your question. For example in your data, why not three or four gaussians? Any two of those could form a local minimum in the fitting problem. So, the question as asked is a good question, and clustering is an established approach to the problem.Satiny
A
6

There is a difference between fitting a curve to pass through a set of points using a Gaussian curve and modeling a probability distribution of some data using GMM.

When you use GMM you are doing the later, and it won't work.

  • If you apply GMM using only the variable on the Y axis you will get a Gaussian distribution of Y that does not take into account the X variable.
  • If you apply GMM using 2 variables you will get bi dimensional Gaussians that won't be of any help for your problem.

Now if what you want is to fit a Gaussian curve. Try the answer to this question.

import numpy
from scipy.optimize import curve_fit
import matplotlib.pyplot as plt

# Define some test data which is close to Gaussian
data = numpy.random.normal(size=10000)

hist, bin_edges = numpy.histogram(data, density=True)
bin_centres = (bin_edges[:-1] + bin_edges[1:])/2

# Define model function to be used to fit to the data above:
# Adapt it to as many gaussians you may want
# by copying the function with different A2,mu2,sigma2 parameters
def gauss(x, *p):
    A, mu, sigma = p
    return A*numpy.exp(-(x-mu)**2/(2.*sigma**2))

# p0 is the initial guess for the fitting coefficients (A, mu and sigma above)
p0 = [1., 0., 1.]

coeff, var_matrix = curve_fit(gauss, bin_centres, hist, p0=p0)

# Get the fitted curve
hist_fit = gauss(bin_centres, *coeff)

plt.plot(bin_centres, hist, label='Test data')
plt.plot(bin_centres, hist_fit, label='Fitted data')

# Finally, lets get the fitting parameters, i.e. the mean and standard deviation:
print 'Fitted mean = ', coeff[1]
print 'Fitted standard deviation = ', coeff[2]

plt.show()

Update on how to adapt the code for multiple gaussians:

def gauss2(x, *p):
    A1, mu1, sigma1, A2, mu2, sigma2 = p
    return A1*numpy.exp(-(x-mu1)**2/(2.*sigma1**2)) + A2*numpy.exp(-(x-mu2)**2/(2.*sigma2**2))

# p0 is the initial guess for the fitting coefficients initialize them differently so the optimization algorithm works better
p0 = [1., -1., 1.,1., -1., 1.]

#optimize and in the end you will have 6 coeff (3 for each gaussian)
coeff, var_matrix = curve_fit(gauss, X_data, y_data, p0=p0)

#you can plot each gaussian separately using 
pg1 = coeff[0:3]
pg2 = coeff[3:]

g1 = gauss(X_data, *pg1)
g2 = gauss(X_data, *pg2)

plt.plot(X_data, y_data, label='Data')
plt.plot(X_data, g1, label='Gaussian1')
plt.plot(X_data, g2, label='Gaussian2')
Altagraciaaltaic answered 3/8, 2018 at 7:16 Comment(4)
Yeah, I see that difference. I have been able to use curve fit through the points to get one of the peaks. I have not figured out how to use curve fit to get multiple, distinct gaussians. Is what you are saying here: "# Define model function to be used to fit to the data above: # Adapt it to as many gaussians you may want # by copying the function with different A2,mu2,sigma2 parameters" That I write something like : def gauss2 with an A2, mu2,sigma2 and call both gauss and gauss2 on the same graph that I have? I understood that they would both return the red curve and not the green.Dionne
Adapted the code to handle 2 gaussians showing how to retrieve them and plot themAltagraciaaltaic
@Dionne and GabrielM, This is the trivial case where we know how many gaussians are present and can guess the initial parameters. Even for two it can easily be unstable. I would be interested to see something that is responsive to the question as asked, i.e. using clustering to ascertain the number of gaussians and the initial guess. It is a very good question.Satiny
@Dionne and GabrielM, A 1-d gaussian mixture example can be found here: astroml.org/book_figures/chapter4/fig_GMM_1D.htmlSatiny

© 2022 - 2024 — McMap. All rights reserved.