create a dump file from my application process from task manager when application is crashes
That's not a good choice, because
- you don't have much time to do so. You can only do that as long as the crash dialog is displayed. If you're too late, the application is gone.
- in that state, you'll have difficulties debugging it. Instead of the original exception, it will show a breakpoint, which is used by the OS to show the dialog and collect diagnostic data
Use WER local dumps to automatically create a crash dump when it crashes instead of doing it manually. It's much more reliable and gives you the original exception. See How do I take a good crash dump for .NET
I am on the right direction in finding memory leaks issue?
Sorry, you're on the wrong track already.
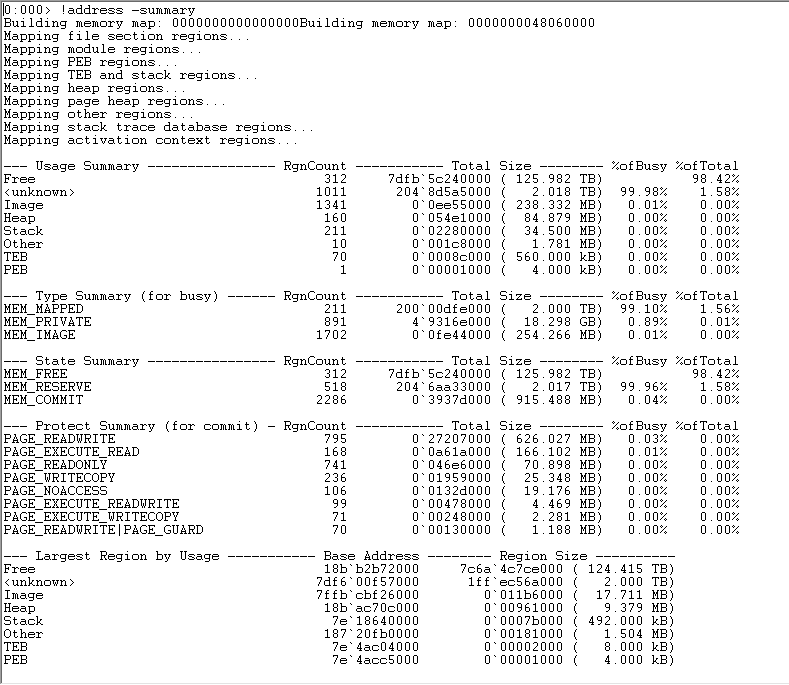
Starting with !dumpheap -stat is not a good idea. Usually one would start at the lowest level, which is !address -summary. It will give you an indicator whether it's a managed memory leak or a native memory leak. If it's a managed leak, you could continue with !dumpheap -stat
if my path is right where whats my next step?
Even if it's not the right path, it's a good idea that you learn how figure out that you're on the wrong path. So, how do I know?
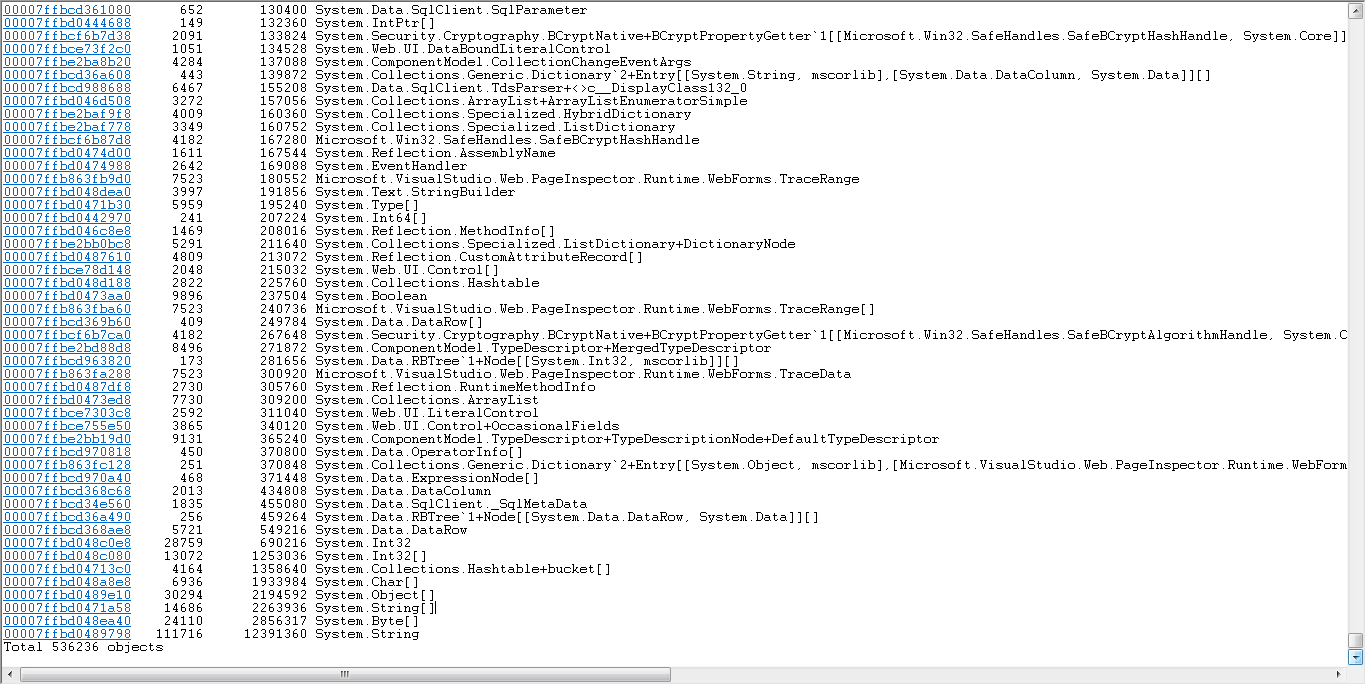
Looking at your output of !dumpheap -stat, you can see
[...]
111716     12391360 System.String.
This tells you there are 110.000 different strings, using 12 MB of memory. It also tells you that everything else takes less than 12 MB. Look at the other sizes and you'll find out that .NET is not the reason for your OutOfMemoryException. They use less than 50 MB.
If there were a managed leak, you would look for paths where objects are connected to, so that the garbage collector thinks it cannot be freed. The command is !gcroot.
Windbg tool is good for finding such kind of issue?
It is possible, but WinDbg is not the best tool. Use a memory profiler instead. That's a dedicated tool for memory leaks. Typically it has a much better usability. Unfortunately you'll need to decide whether you need a managed memory profiler, native memory profiler or both.
I once wrote how to use WinDbg to track down .NET OutOfMemoryException. You'll find a chart there which gives you ideas on how to proceed in different situations.
In your dump I see 2 TB of <unknown> memory, which could be .NET, but needn't be. Still, these 2 TB are likely the cause of the OOM, because the rest is less than 350 MB in size.
Since clr is in the list of loaded modules, we can check !dumpheap -stat as you did. But there are not many objects using memory.
!eeheap -gc shows that there are 8 heaps, corresponding to the 8 processors of your machine, for parallel garbage collection. The largest individual heap is 45 MB, the total 249 MB. This roughly matches the sum of !dumpheap. conclusion: .NET is not the culprit.
Let's check the special cases:
- Presence of MSXML
- Bitmaps
- Calls to
HeapAlloc() which are so large that they are directly forwarded to VirtualAlloc().
- Direct calls to
VirtualAlloc()
MSXML is not present: lm m msxml* does not produce output.
There are no Bitmaps: !dumpheap -stat -type Bitmap
Heap allocations larger than 512 kB: !heap -stat. Here's a truncated part of the output:
0:000> !heap -stat
_HEAP 0000018720bd0000
     Segments            00000006
         Reserved  bytes 0000000001fca000
         Committed bytes 0000000001bb3000
     VirtAllocBlocks     00000002
         VirtAlloc bytes 00000312cdc4b110
_HEAP 0000018bb0fe0000
     Segments            00000005
         Reserved  bytes 0000000000f0b000
         Committed bytes 0000000000999000
     VirtAllocBlocks     00000001
         VirtAlloc bytes 0000018bb0fe0110
As you can see, there are 3 blocks that went to VirtualAlloc. The size is somewhat unrealistic:
0:000> ? 00000312cdc4b110
Evaluate expression: 3379296514320 = 00000312`cdc4b110
0:000> ? 0000018bb0fe0110
Evaluate expression: 1699481518352 = 0000018b`b0fe0110
That would be a total of 3.3TB + 1.7TB = 6TB and not 2TB. Now, it may happen that this is a bug of !address, but 4TB is not a common overflow point.
With !heap -a 0000018720bd0000 you can see the 2 virtual allocs:
Virtual Alloc List:   18720bd0110
    0000018bac70c000: 00960000 [commited 961000, unused 1000] - busy (b), tail fill
    0000018bad07b000: 00960000 [commited 961000, unused 1000] - busy (b), tail fill
And with !heap -a 0000018bb0fe0000 you can see the third one:
Virtual Alloc List:   18bb0fe0110
    0000018bb1043000: 00400000 [commited 401000, unused 1000] - busy (b), tail fill
These are all relatively small blocks of 4.1MB and 9.8 MB.
For the last part, direct calls to VirtualAlloc(), you need to get back to the level of !address. With !address -f:VAR -c:".echo %1 %3" you can see the address and size of all <unknown> regions. You'll find a lot of entries there, many of small sizes, some which could be the .NET heaps, a few 2GB ones and one really large allocation
The 2GB ones:
0x18722070000 0x2d11000
0x18724d81000 0x7d2ef000
0x187a2070000 0x2ff4000
0x187a5064000 0x7d00c000
0x18822070000 0x2dfe000
0x18824e6e000 0x7d202000
0x188a2070000 0x2c81000
0x188a4cf1000 0x7d37f000
0x18922070000 0x2d13000
0x18924d83000 0x7d2ed000
0x189a2070000 0x2f5a000
0x189a4fca000 0x7d0a6000
0x18a22070000 0x2c97000
0x18a24d07000 0x7d369000
0x18aa2070000 0x2d0c000
0x18aa4d7c000 0x7d2f4000
It is likely that these are the .NET heaps (committed part + reserved part).
The large one:
0x7df600f57000 0x1ffec56a000
The information about it:
0:000> !address 0x7df600f57000

Usage:                  <unknown>
Base Address:           00007df6`00f57000
End Address:            00007ff5`ed4c1000
Region Size:            000001ff`ec56a000 (   2.000 TB)
State:                  00002000          MEM_RESERVE
Protect:                <info not present at the target>
Type:                   00040000          MEM_MAPPED
Allocation Base:        00007df5`ff340000
Allocation Protect:     00000001          PAGE_NOACCESS
It looks like a 2TB memory mapped file which is unused (and therefore reserved).
I don't know what your application is doing. This is really where I need to stop the analysis. I hope this was helpful and you can draw your conclusions and fix the issue.


