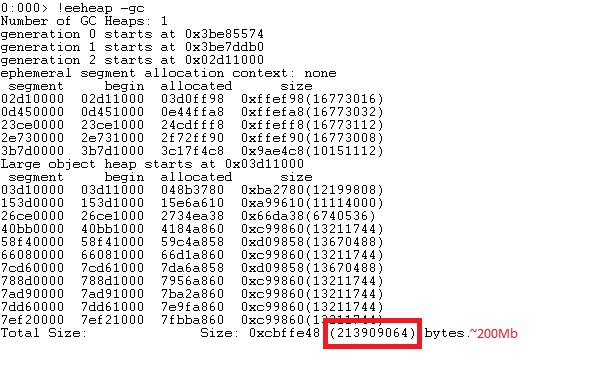
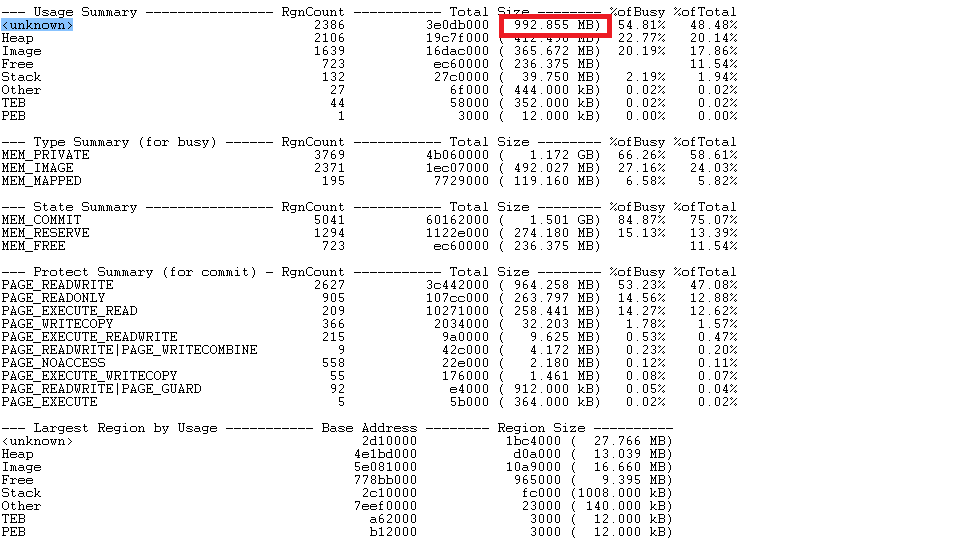
I'm debugging a Winforms application for a memory leak. In the dump file provided by the customer there is a large discrepancy between the unknown memory usage and the .NET Heap size. (Approximately 1000mb vs 200mb). So what is in the unknown segment other than the VirtualAllocs done by the CLR?
!eeheap -gc output
!address -summary output


