You can do this using the function fill3 and referencing this answer for the 2D case to see how you have to add points on the ends of your data vectors to "close" your filled polygons. Although creating a pattern (i.e. hatching) is difficult if not impossible, an alternative is to simply adjust the alpha transparency of the filled patch. Here's a simple example for just one patch:
x = 1:10;
y = rand(1, 10);
hFill = fill3(zeros(1, 12), x([1 1:end end]), [0 y 0], 'b', 'FaceAlpha', 0.5);
grid on
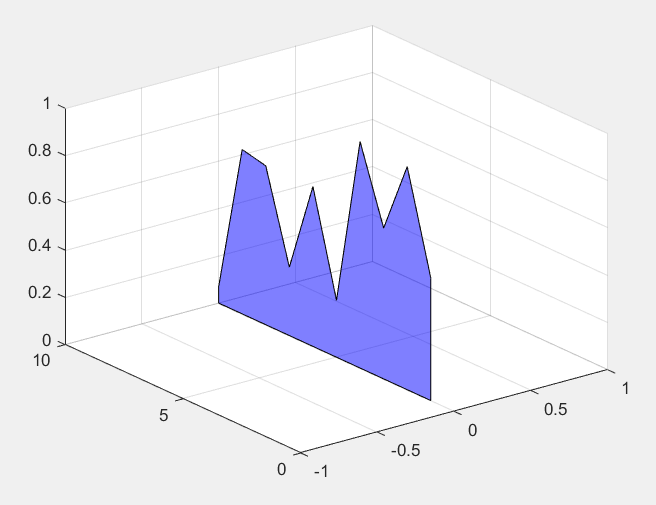
And here's the plot this makes:
![enter image description here]()
You can also create multiple patches in one call to fill3. Here's an example with 4 sets of data:
nPoints = 10;  % Number of data points
nPlots = 4;    % Number of curves
data = rand(nPoints, nPlots);  % Sample data, one curve per column

% Create data matrices:
[X, Y] = meshgrid(0:(nPlots-1), [1 1:nPoints nPoints]);
Z = [zeros(1, nPlots); data; zeros(1, nPlots)];
patchColor = [0 0.4470 0.7410];  % RGB color for patch edge and face

% Plot patches:
hFill = fill3(X, Y, Z, patchColor, 'LineWidth', 1, 'EdgeColor', patchColor, ...
              'FaceAlpha', 0.5);
set(gca, 'YDir', 'reverse', 'YLim', [1 nPoints]);
grid on
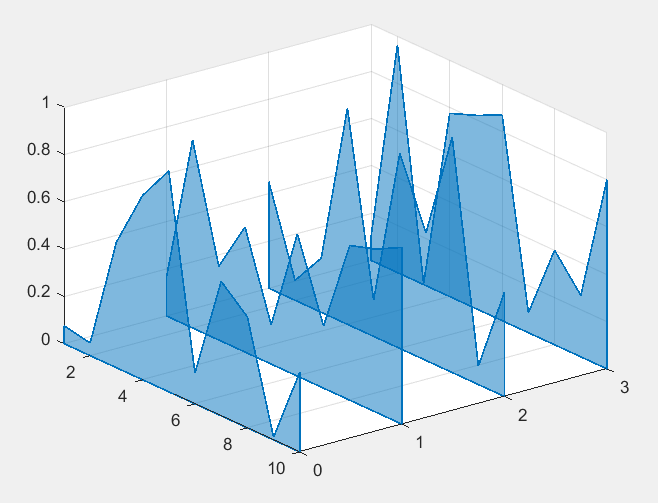
And here's the plot this makes:
![enter image description here]()


