Add points to usmap with ggplot in r
Asked Answered
S

2

7

I was able to create a US map with this tutorial. When I tried to add additional points to it they all ended up in South Dakota, no matter what I input for data.

library(ggplot2)
library(usmap)
testData <- data.frame(LATITUDE = 20.31557, LONGITUDE = -102.42547)
p <- plot_usmap( regions = "state") 
p + geom_point(data = testData, aes(x = LONGITUDE, y = LATITUDE), color = "red")
Shrinkage answered 21/10, 2018 at 3:15 Comment(0)
R
3

That's an "interesting" package that doesn't have much value-add over the blog post code the underlying shapefiles were generated from (yet the package author did not see fit to credit the author of the blog post in the package DESCRIPTION, just a tack-on to the end of a README).

One thing the author also did not see fit to do is provide support for anything but choropleths. Your problem is that the map is in one coordinate system and your points are in another.

If you can use non-CRAN packages, albersusa (which was around for a while before the usamap author did the copypasta package) provides the necessary glue:

library(albersusa) # https://gitlab.com/hrbrmstr/albersusa / https://github.com/hrbrmstr/albersusa
library(ggplot2)
library(sp)

Get the US map pre-projected:

us <- usa_composite(proj = "aeqd")

We'll use built-in "state.center" data to get some points

states_centers <- as.data.frame(state.center)
states_centers$name <- state.name

However, if you look up the help on state.center you'll see that they don't provide legit coords for Alaska & Hawaii, we we can't use them:

states_centers <- states_centers[!(states_centers$name %in% c("Alaska", "Hawaii")),]

NOTE: If you do have points in Alaska/Hawaii you need to se the 'points_elided() function in the package to modify any Alaska or Hawaii points. A longstanding TODO has been to make points_elided() support all the transforms but I almost never need to use the package outside of choropleths so it'll be TODO for a while.

Now, make them legit coords for our map by going from straight long/lat to the projected coordinate system:

coordinates(states_centers) <- ~x+y
proj4string(states_centers) <- CRS(us_longlat_proj)
states_centers <- spTransform(states_centers, CRSobj = CRS(us_aeqd_proj))
states_centers <- as.data.frame(coordinates(states_centers))

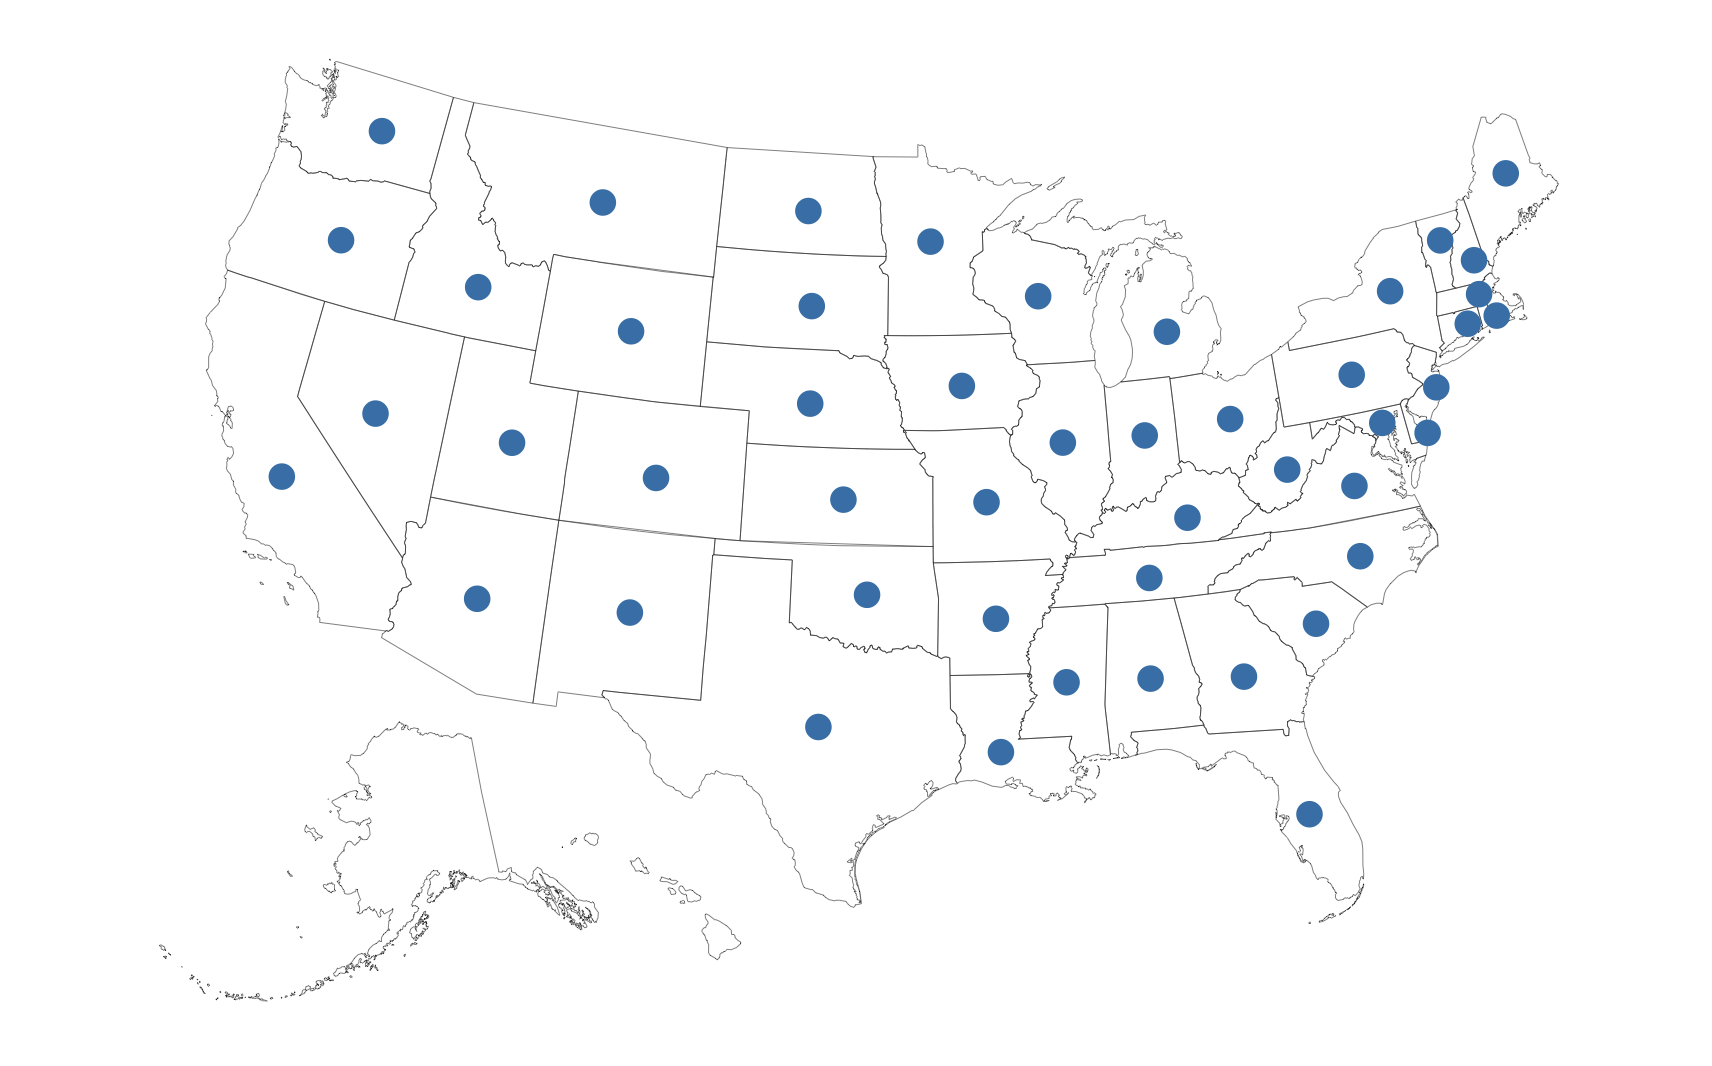
And, plot them:

us_map <- fortify(us, region="name")

ggplot() +
  geom_map(
    data = us_map, map = us_map,
    aes(x = long, y = lat, map_id = id),
    color = "#2b2b2b", size = 0.1, fill = NA
  ) +
  geom_point(
    data = states_centers, aes(x, y), size = 4, color = "steelblue"
  ) +
  coord_equal() + # the points are pre-projected
  ggthemes::theme_map()

enter image description here

Rooney answered 21/10, 2018 at 11:55 Comment(3)
I'm the maintainer of usmap. Is there a recommended way to credit your blog post in the DESCRIPTION? I wasn't aware of how to do that when I was creating the package but I would be more than happy to include it in the appropriate place.Cyperaceous
@Cyperaceous Id also like to point out that usmap does have a value added feature. It does not rely on non R libraries such as geos and gdal, which can be problematic if you don't have admin access to your environment. So thank you for the package. Is there a way to project state and county boundaries using contrasting colors with your package?Seer
#59852323 I posted here...Seer
C
7

As of usmap 0.5.0, a new function exists called usmap_transform which transforms a data.frame to match the projection used by usmap.

Here is an example similar to the data you provided:

library(usmap)
library(ggplot2)

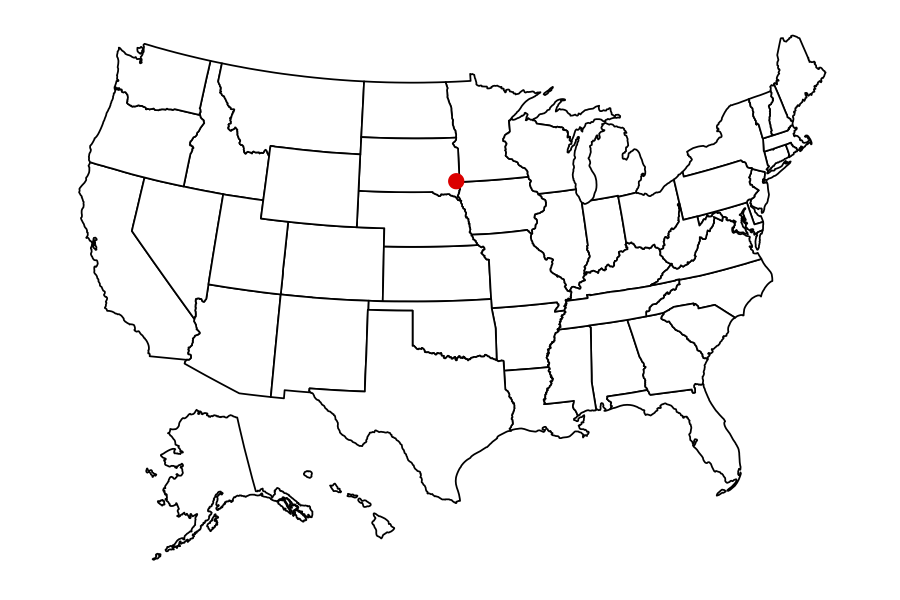
# Lat/Lon of Sioux Falls, SD
test_data <- data.frame(lon = -96.70, lat = 43.55)

transformed_data <- usmap_transform(test_data)

plot_usmap("states") + 
  geom_point(data = transformed_data, 
             aes(x = x, y = y), 
             color = "red",
             size = 3)

Plot showing a single red point on a US map, where Sioux Falls, SD is located

There is also a new vignette called Advanced Mapping which shows this in more detail.

Cyperaceous answered 17/9, 2019 at 18:49 Comment(0)
R
3

That's an "interesting" package that doesn't have much value-add over the blog post code the underlying shapefiles were generated from (yet the package author did not see fit to credit the author of the blog post in the package DESCRIPTION, just a tack-on to the end of a README).

One thing the author also did not see fit to do is provide support for anything but choropleths. Your problem is that the map is in one coordinate system and your points are in another.

If you can use non-CRAN packages, albersusa (which was around for a while before the usamap author did the copypasta package) provides the necessary glue:

library(albersusa) # https://gitlab.com/hrbrmstr/albersusa / https://github.com/hrbrmstr/albersusa
library(ggplot2)
library(sp)

Get the US map pre-projected:

us <- usa_composite(proj = "aeqd")

We'll use built-in "state.center" data to get some points

states_centers <- as.data.frame(state.center)
states_centers$name <- state.name

However, if you look up the help on state.center you'll see that they don't provide legit coords for Alaska & Hawaii, we we can't use them:

states_centers <- states_centers[!(states_centers$name %in% c("Alaska", "Hawaii")),]

NOTE: If you do have points in Alaska/Hawaii you need to se the 'points_elided() function in the package to modify any Alaska or Hawaii points. A longstanding TODO has been to make points_elided() support all the transforms but I almost never need to use the package outside of choropleths so it'll be TODO for a while.

Now, make them legit coords for our map by going from straight long/lat to the projected coordinate system:

coordinates(states_centers) <- ~x+y
proj4string(states_centers) <- CRS(us_longlat_proj)
states_centers <- spTransform(states_centers, CRSobj = CRS(us_aeqd_proj))
states_centers <- as.data.frame(coordinates(states_centers))

And, plot them:

us_map <- fortify(us, region="name")

ggplot() +
  geom_map(
    data = us_map, map = us_map,
    aes(x = long, y = lat, map_id = id),
    color = "#2b2b2b", size = 0.1, fill = NA
  ) +
  geom_point(
    data = states_centers, aes(x, y), size = 4, color = "steelblue"
  ) +
  coord_equal() + # the points are pre-projected
  ggthemes::theme_map()

enter image description here

Rooney answered 21/10, 2018 at 11:55 Comment(3)
I'm the maintainer of usmap. Is there a recommended way to credit your blog post in the DESCRIPTION? I wasn't aware of how to do that when I was creating the package but I would be more than happy to include it in the appropriate place.Cyperaceous
@Cyperaceous Id also like to point out that usmap does have a value added feature. It does not rely on non R libraries such as geos and gdal, which can be problematic if you don't have admin access to your environment. So thank you for the package. Is there a way to project state and county boundaries using contrasting colors with your package?Seer
#59852323 I posted here...Seer

© 2022 - 2024 — McMap. All rights reserved.