L1 memory bandwidth: 50% drop in efficiency using addresses which differ by 4096+64 bytes
Asked Answered
K

2

11

I want to achieve the maximum bandwidth of the following operations with Intel processors.

for(int i=0; i<n; i++) z[i] = x[i] + y[i]; //n=2048

where x, y, and z are float arrays. I am doing this on Haswell, Ivy Bridge , and Westmere systems.

I originally allocated the memory like this

char *a = (char*)_mm_malloc(sizeof(float)*n, 64);
char *b = (char*)_mm_malloc(sizeof(float)*n, 64);
char *c = (char*)_mm_malloc(sizeof(float)*n, 64);
float *x = (float*)a; float *y = (float*)b; float *z = (float*)c;

When I did this I got about 50% of the peak bandwidth I expected for each system.

The peak values is calculated as frequency * average bytes/clock_cycle. The average bytes/clock cycle for each system is:

Core2: two 16 byte reads one 16 byte write per 2 clock cycles     -> 24 bytes/clock cycle
SB/IB: two 32 byte reads and one 32 byte write per 2 clock cycles -> 48 bytes/clock cycle
Haswell: two 32 byte reads and one 32 byte write per clock cycle  -> 96 bytes/clock cycle

This means that e.g. on Haswell I I only observe 48 bytes/clock cycle (could be two reads in one clock cycle and one write the next clock cycle).

I printed out the difference in the address of b-a and c-b and each are 8256 bytes. The value 8256 is 8192+64. So they are each larger than the array size (8192 bytes) by one cache-line.

On a whim I tried allocating the memory like this.

const int k = 0;
char *mem = (char*)_mm_malloc(1<<18,4096);
char *a = mem;
char *b = a+n*sizeof(float)+k*64;
char *c = b+n*sizeof(float)+k*64;
float *x = (float*)a; float *y = (float*)b; float *z = (float*)c;

This nearly doubled my peak bandwidth so that I now get around 90% of the peak bandwidth. However, when I tried k=1 it dropped back to 50%. I have tried other values of k and found that e.g. k=2, k=33, k=65 only gets 50% of the peak but e.g. k=10, k=32, k=63 gave the full speed. I don't understand this.

In Agner Fog's micrarchitecture manual he says that there is a false dependency with memory address with the same set and offset

It is not possible to read and write simultaneously from addresses that are spaced by a multiple of 4 Kbytes.

But that's exactly where I see the biggest benefit! When k=0 the memory address differ by exactly 2*4096 bytes. Agner also talks about Cache bank conflicts. But Haswell and Westmere are not suppose to have these bank conflicts so that should not explain what I am observing. What's going on!?

I understand that the OoO execution decides which address to read and write so even if the arrays' memory addresses differ by exactly 4096 bytes that does not necessarily mean the processor reads e.g. &x[0] and writes &z[0] at the same time but then why would being off by a single cache line cause it to choke?

Edit: Based on Evgeny Kluev's answer I now believe this is what Agner Fog calls a "bogus store forwarding stall". In his manual under the Pentium Pro, II and II he writes:

Interestingly, you can get a get a bogus store forwarding stall when writing and reading completely different addresses if they happen to have the same set-value in different cache banks:

; Example 5.28. Bogus store-to-load forwarding stall
mov byte ptr [esi], al
mov ebx, dword ptr [esi+4092]
; No stall
mov ecx, dword ptr [esi+4096]
; Bogus stall

Edit: Here is table of the efficiencies on each system for k=0 and k=1.

               k=0      k=1        
Westmere:      99%      66%
Ivy Bridge:    98%      44%
Haswell:       90%      49%

I think I can explain these numbers if I assume that for k=1 that writes and reads cannot happen in the same clock cycle.

       cycle     Westmere          Ivy Bridge           Haswell
           1     read  16          read  16 read  16    read  32 read 32
           2     write 16          read  16 read  16    write 32
           3                       write 16
           4                       write 16  

k=1/k=0 peak    16/24=66%          24/48=50%            48/96=50%

This theory works out pretty well. Ivy bridge is a bit lower than I would expect but Ivy Bridge suffers from bank cache conflicts where the others don't so that may be another effect to consider.

Below is working code to test this yourself. On a system without AVX compile with g++ -O3 sum.cpp otherwise compile with g++ -O3 -mavx sum.cpp. Try varying the value k.

//sum.cpp
#include <x86intrin.h>
#include <stdio.h>
#include <string.h>
#include <time.h>

#define TIMER_TYPE CLOCK_REALTIME

double time_diff(timespec start, timespec end)
{
    timespec temp;
    if ((end.tv_nsec-start.tv_nsec)<0) {
        temp.tv_sec = end.tv_sec-start.tv_sec-1;
        temp.tv_nsec = 1000000000+end.tv_nsec-start.tv_nsec;
    } else {
        temp.tv_sec = end.tv_sec-start.tv_sec;
        temp.tv_nsec = end.tv_nsec-start.tv_nsec;
    }
    return (double)temp.tv_sec +  (double)temp.tv_nsec*1E-9;
}

void sum(float * __restrict x, float * __restrict y, float * __restrict z, const int n) {
    #if defined(__GNUC__)
    x = (float*)__builtin_assume_aligned (x, 64);
    y = (float*)__builtin_assume_aligned (y, 64);
    z = (float*)__builtin_assume_aligned (z, 64);
    #endif
    for(int i=0; i<n; i++) {
        z[i] = x[i] + y[i];
    }
}

#if (defined(__AVX__))
void sum_avx(float *x, float *y, float *z, const int n) {
    float *x1 = x;
    float *y1 = y;
    float *z1 = z;
    for(int i=0; i<n/64; i++) { //unroll eight times
        _mm256_store_ps(z1+64*i+  0,_mm256_add_ps(_mm256_load_ps(x1+64*i+ 0), _mm256_load_ps(y1+64*i+  0)));
        _mm256_store_ps(z1+64*i+  8,_mm256_add_ps(_mm256_load_ps(x1+64*i+ 8), _mm256_load_ps(y1+64*i+  8)));
        _mm256_store_ps(z1+64*i+ 16,_mm256_add_ps(_mm256_load_ps(x1+64*i+16), _mm256_load_ps(y1+64*i+ 16)));
        _mm256_store_ps(z1+64*i+ 24,_mm256_add_ps(_mm256_load_ps(x1+64*i+24), _mm256_load_ps(y1+64*i+ 24)));
        _mm256_store_ps(z1+64*i+ 32,_mm256_add_ps(_mm256_load_ps(x1+64*i+32), _mm256_load_ps(y1+64*i+ 32)));
        _mm256_store_ps(z1+64*i+ 40,_mm256_add_ps(_mm256_load_ps(x1+64*i+40), _mm256_load_ps(y1+64*i+ 40)));
        _mm256_store_ps(z1+64*i+ 48,_mm256_add_ps(_mm256_load_ps(x1+64*i+48), _mm256_load_ps(y1+64*i+ 48)));
        _mm256_store_ps(z1+64*i+ 56,_mm256_add_ps(_mm256_load_ps(x1+64*i+56), _mm256_load_ps(y1+64*i+ 56)));
    }
}
#else
void sum_sse(float *x, float *y, float *z, const int n) {
    float *x1 = x;
    float *y1 = y;
    float *z1 = z;
    for(int i=0; i<n/32; i++) { //unroll eight times
        _mm_store_ps(z1+32*i+  0,_mm_add_ps(_mm_load_ps(x1+32*i+ 0), _mm_load_ps(y1+32*i+  0)));
        _mm_store_ps(z1+32*i+  4,_mm_add_ps(_mm_load_ps(x1+32*i+ 4), _mm_load_ps(y1+32*i+  4)));
        _mm_store_ps(z1+32*i+  8,_mm_add_ps(_mm_load_ps(x1+32*i+ 8), _mm_load_ps(y1+32*i+  8)));
        _mm_store_ps(z1+32*i+ 12,_mm_add_ps(_mm_load_ps(x1+32*i+12), _mm_load_ps(y1+32*i+ 12)));
        _mm_store_ps(z1+32*i+ 16,_mm_add_ps(_mm_load_ps(x1+32*i+16), _mm_load_ps(y1+32*i+ 16)));
        _mm_store_ps(z1+32*i+ 20,_mm_add_ps(_mm_load_ps(x1+32*i+20), _mm_load_ps(y1+32*i+ 20)));
        _mm_store_ps(z1+32*i+ 24,_mm_add_ps(_mm_load_ps(x1+32*i+24), _mm_load_ps(y1+32*i+ 24)));
        _mm_store_ps(z1+32*i+ 28,_mm_add_ps(_mm_load_ps(x1+32*i+28), _mm_load_ps(y1+32*i+ 28)));
    }
}
#endif

int main () {
    const int n = 2048;
    const int k = 0;
    float *z2 = (float*)_mm_malloc(sizeof(float)*n, 64);

    char *mem = (char*)_mm_malloc(1<<18,4096);
    char *a = mem;
    char *b = a+n*sizeof(float)+k*64;
    char *c = b+n*sizeof(float)+k*64;

    float *x = (float*)a;
    float *y = (float*)b;
    float *z = (float*)c;
    printf("x %p, y %p, z %p, y-x %d, z-y %d\n", a, b, c, b-a, c-b);

    for(int i=0; i<n; i++) {
        x[i] = (1.0f*i+1.0f);
        y[i] = (1.0f*i+1.0f);
        z[i] = 0;
    }
    int repeat = 1000000;
    timespec time1, time2;

    sum(x,y,z,n);
    #if (defined(__AVX__))
    sum_avx(x,y,z2,n);
    #else
    sum_sse(x,y,z2,n);
    #endif
    printf("error: %d\n", memcmp(z,z2,sizeof(float)*n));

    while(1) {
        clock_gettime(TIMER_TYPE, &time1);
        #if (defined(__AVX__))
        for(int r=0; r<repeat; r++) sum_avx(x,y,z,n);
        #else
        for(int r=0; r<repeat; r++) sum_sse(x,y,z,n);
        #endif
        clock_gettime(TIMER_TYPE, &time2);

        double dtime = time_diff(time1,time2);
        double peak = 1.3*96; //haswell @1.3GHz
        //double peak = 3.6*48; //Ivy Bridge @ 3.6Ghz
        //double peak = 2.4*24; // Westmere @ 2.4GHz
        double rate = 3.0*1E-9*sizeof(float)*n*repeat/dtime;
        printf("dtime %f, %f GB/s, peak, %f, efficiency %f%%\n", dtime, rate, peak, 100*rate/peak);
    }
}
Karen answered 10/9, 2014 at 20:8 Comment(9)
Try running it under a decent profiler and see if you're getting e.g. TLB misses?Loos
I don't have much experience with Intel caches since they tend to behave well enough where I don't need to study them. But on AMD, I know that padding a single cacheline is not enough. You need to pad enough such that there are no bank conflicts between anything that's still in the store buffer. i.e. You need at least 20+ cycles before you can safely overlap into the same bank without hitting a conflict.Eolic
@PaulR, that's a great idea. I don't have experience with "a decent profiler". Can you recommend one for me? I want to profile GCC code on Linux.Karen
@Mysticial, yeah, I was thinking this might have to do with store buffer. It appear to me that I'm running into the false dependency at 4KB. If the arrays are 4KB aligned it's not a problem because it always reads ahead of what it writes. But when the write array memory address is ahead by one cache line then the reads and writes sometimes are multiples of 4KB. In this case it seems to always happens so it can't read and write in the same clock cycle.Karen
For Linux you could try oprofile (free), or the free evaluation of Zoom, or Intel's VTune, which I think is free for non-comercial use on Linux (?). FWIW I use Instruments on OS X.Loos
@Mysticial, I updated my quesiton with a table showing the efficiency for each system. I pretty convinced of my theory now that with k=l that a read and write cannot happen in the same clock cycle. I'm not sure exactly why but I think it's related to the 4KB false dependency.Karen
@PaulR, thank you! I have been meaning to try Agner Fog's test programs ("Can measure clock cycles and performance monitor counters such as cache misses, branch mispredictions, resource stalls etc."). It's what he uses for his instruction tables. It's the last tool of his I have not learned yet. Have you tried this?Karen
I haven't tried that yet - most good profilers already have support for performance counters etc, but they can be fiddly to use (there tend to be a huge number of performance counters on modern CPUs, and you often have to combine them in non-obivous ways to get meaningful results). I'd be interested to hear how you get on though.Loos
I've updated my answer to show how you can easily change the code to eliminate 4K aliasing (using loop fission).Ehling
H
9

I think the gap between a and b does not really matter. After leaving only one gap between b and c I've got the following results on Haswell:

k   %
-----
1  48
2  48
3  48
4  48
5  46
6  53
7  59
8  67
9  73
10 81
11 85
12 87
13 87
...
0  86

Since Haswell is known to be free of bank conflicts, the only remaining explanation is false dependence between memory addresses (and you've found proper place in Agner Fog's microarchitecture manual explaining exactly this problem). The difference between bank conflict and false sharing is that bank conflict prevents accessing the same bank twice during the same clock cycle while false sharing prevents reading from some offset in 4K piece of memory just after you've written something to same offset (and not only during the same clock cycle but also for several clock cycles after the write).

Since your code (for k=0) writes to any offset just after doing two reads from the same offset and would not read from it for a very long time, this case should be considered as "best", so I placed k=0 at the end of the table. For k=1 you always read from offset that is very recently overwritten, which means false sharing and therefore performance degradation. With larger k time between write and read increases and CPU core has more chances to pass written data through all memory hierarchy (which means two address translations for read and write, updating cache data and tags and getting data from cache, data synchronization between cores, and probably many more stuff). k=12 or 24 clocks (on my CPU) is enough for every written piece of data to be ready for subsequent read operations, so starting with this value performance gets back to usual. Looks not very different from 20+ clocks on AMD (as said by @Mysticial).

Heartbeat answered 11/9, 2014 at 13:31 Comment(14)
Thanks for testing the code. I observe the same thing with Haswell. For k=12 it's back to "normal" on Haswell. On Westmere it's back to normal already by k=4. I think you figured it out I just need to think about it a bit now.Karen
I have a few questions. 1.) It sounds like you're describing store forwarding stalls but I don't see anything in Agner's manual referencing 4Kb for store forward stalls. 2.) How do you explain k=33 being bad? 64*32=2048 so that's only half of the 4Kb. 3.) Lastly, why do you say that k=12 is 24 clocks on your CPU?Karen
Oh, it is a store forwarding stall. I found it in his manual finally the first time he describes store foardwarding stalls in Pentium Pro, II, and III section. "Interestingly, you can get a get a bogus store forwarding stall when writing and reading completely different addresses if they happen to have the same set-value in different cache banks:". This is example 5.28 in his manual.Karen
@Zboson: 1) store-to-load forwarding is a mechanism to alleviate the same problem for the case where instead of false sharing we have "true" sharing, i.e. when addresses are exactly equal, not just low 12 bits of them; that's why no 4Kb is mentioned; to get store-to-load forwarding working properly, some additional requirements should be met, like alignment and size, otherwise we may get store forwarding stalls; in your code addresses are not equal, alignment and size of read and write match each other, so it has false sharing problem, not store forwarding problem.Heartbeat
2) k=33 is bad because with k=32 you have 2 gaps of 2048 bytes, or 4Kb between a and c; and 4Kb is the same as no gap at all, so k=32 is the same as k=0, k=33 same as k=1... 3) k=12 means 24 32-byte blocks, each needs 1 clock to be processed, so 24 clocks.Heartbeat
Okay, that all makes sense now. Thanks! I guess this is why he calls it a bogus store forwarding stall. The more accurate term is false sharing.Karen
From what I read about the store--to-load forwarding the penalty is 10 clock cycles for each system. Even though this is false sharing it effectively acts like a store-to-load stall. How come on my Westmemre system it's already back at fall speed by k=3?Karen
On my IB system it's back at fall speed by k=6. Haswell is the worst.Karen
@Zboson: IB's memory is twice as slow as Haswell's, so k=6 means the same 24 cloks. I don't remember Core2's numbers exactly, but if the table at top of OP is right, Core2's k=3 once again means 24 clocks. So all 3 processors give the same result. Also we cannot be sure that store-to-load penalty is equal to false sharing penalty.Heartbeat
Oh, of course, you're right again. I was thinking in terms of a single write/read not writing 64 bytes. So it all agrees. And I agree that we don't know for sure that the store-to-load penalty is equal to the false sharing penalty. But my guess is that it's effectively the same thing. This has been a very interesting problem.Karen
Sorry to belabor this but one thing is still gnawing at me. Westmere and IB can only write 16 bytes per clock cycle so that can't explain the 3,6,12 scaling I'm seeing. What I think is happening is that there are twice as mean reads as writes for z[i] = x[i] +y[i]. So on Haswell during 12 cycles there would be 24 reads and 12 writes. In other words this is only 12 clock cycles.Karen
Think of this way. Haswell can read 64 bytes/cycle, IB 32 bytes/cycle, and Westmere 16 bytes per cycle so k=12 is 768 bytes and 768/64=12, k=6 is 384 bytes and 384/32=12, k=3 is 192 bytes and 192/16 is 12. So it works out considering there are twice as many reads as writes. This also is closer to the 10 cycle delay I expect.Karen
@Zboson: For Haswell k=12 means 12*2*64=1536 bytes, remember that you read two operands for each "add". 1536/64=24 clocks. The same math is for other processors, and same math for writes; everywhere we have about 24 cycles. Also Agner tells about 10 cycle delay in addition to successful store forwarding, which means a little bit more than 10. And delay after failed forwarding is not exactly the same as number of clocks you should wait before reading from just written offset to avoid stalls for sure.Heartbeat
Okay, we are only debating a factor of 2 now. I think I agree with your factor of two. You mean for k=12 a and b are both read so it's 2*12*64 not 1*12*64. I guess counting the cycles exactly is not easy. I mean 10 + x = 24. I can't explain exactly what is x but it's clear there are addition delays as you explain.Karen
E
7

TL;DR: For certain values of k, too many 4K aliasing conditions occur, which is the main cause for the bandwidth degradation. In 4K aliasing, a load is stalled unnecessarily, thereby increasing the effective load latency and stalling all later dependent instructions. This in turn results in reduced L1 bandwidth utilization. For these values of k, most 4K aliasing conditions can be eliminated by splitting the loop as follows:

for(int i=0; i<n/64; i++) {
    _mm256_store_ps(z1+64*i+  0,_mm256_add_ps(_mm256_load_ps(x1+64*i+ 0), _mm256_load_ps(y1+64*i+  0)));
    _mm256_store_ps(z1+64*i+  8,_mm256_add_ps(_mm256_load_ps(x1+64*i+ 8), _mm256_load_ps(y1+64*i+  8)));
}
for(int i=0; i<n/64; i++) {
    _mm256_store_ps(z1+64*i+ 16,_mm256_add_ps(_mm256_load_ps(x1+64*i+16), _mm256_load_ps(y1+64*i+ 16)));
    _mm256_store_ps(z1+64*i+ 24,_mm256_add_ps(_mm256_load_ps(x1+64*i+24), _mm256_load_ps(y1+64*i+ 24)));
}
for(int i=0; i<n/64; i++) {
    _mm256_store_ps(z1+64*i+ 32,_mm256_add_ps(_mm256_load_ps(x1+64*i+32), _mm256_load_ps(y1+64*i+ 32)));
    _mm256_store_ps(z1+64*i+ 40,_mm256_add_ps(_mm256_load_ps(x1+64*i+40), _mm256_load_ps(y1+64*i+ 40)));
}
for(int i=0; i<n/64; i++) {
    _mm256_store_ps(z1+64*i+ 48,_mm256_add_ps(_mm256_load_ps(x1+64*i+48), _mm256_load_ps(y1+64*i+ 48)));
    _mm256_store_ps(z1+64*i+ 56,_mm256_add_ps(_mm256_load_ps(x1+64*i+56), _mm256_load_ps(y1+64*i+ 56)));
}

This split eliminates most 4K aliasing for the cases when k is an odd positive integer (such as 1). The achieved L1 bandwidth is improved by about 50% on Haswell. There is still room for improvement, for example, by unrolling the loop and figuring out a way to not use the indexed-addressing mode for loads and stores.

However, this split doesn't eliminate 4K aliasing for even values of k. So a different split needs to be used for even values of k. However, when k is 0, optimal performance can be achieved without splitting the loop. In this case, performance is backend-bound on ports 1, 2, 3, 4, and 7 simultaneously.

There could be a penalty of a few cycles in certain cases when performing a load and store at the same time, but in this particular case, this penalty basically does not exist because there are basically no such conflicts (i.e., the addresses of concurrent loads and stores are sufficiently far apart). In addition, the total working set size fits in the L1 so there is no L1-L2 traffic beyond the first execution of the loop.

The rest of this answer includes a detailed explanation of this summary.


First, observe that the three arrays have a total size of 24KB. In addition, since you're initializing the arrays before executing the main loop, most accesses in the main loop will hit into the L1D, which is 32KB in size and 8-way associative on modern Intel processors. So we don't have to worry about misses or hardware prefetching. The most important performance event in this case is LD_BLOCKS_PARTIAL.ADDRESS_ALIAS, which occurs when a partial address comparison involving a later load results in a match with an earlier store and all of the conditions of store forwarding are satisfied, but the target locations are actually different. Intel refers to this situation as 4K aliasing or false store forwarding. The observable performance penalty of 4K aliasing depends on the surrounding code.

By measuring cycles, LD_BLOCKS_PARTIAL.ADDRESS_ALIAS and MEM_UOPS_RETIRED.ALL_LOADS, we can see that for all values of k where the achieved bandwidth is much smaller than the peak bandwidth, LD_BLOCKS_PARTIAL.ADDRESS_ALIAS and MEM_UOPS_RETIRED.ALL_LOADS are almost equal. Also for all values of k where the achieved bandwidth is close to the peak bandwidth, LD_BLOCKS_PARTIAL.ADDRESS_ALIAS is very small compared to MEM_UOPS_RETIRED.ALL_LOADS. This confirms that bandwidth degradation is occurring due to most loads suffering from 4K aliasing.

The Intel optimization manual Section 12.8 says the following:

4-KByte memory aliasing occurs when the code stores to one memory location and shortly after that it loads from a different memory location with a 4-KByte offset between them. For example, a load to linear address 0x400020 follows a store to linear address 0x401020.

The load and store have the same value for bits 5 - 11 of their addresses and the accessed byte offsets should have partial or complete overlap.

That is, there are two necessary conditions for a later load to alias with an earlier store:

  • Bits 5-11 of the two linear addresses must be equal.
  • The accessed locations must overlap (so that there can be some data to forward).

On processors that support AVX-512, it seems to me that a single load uop can load up to 64 bytes. So I think the range for the first condition should be 6-11 instead of 5-11.

The following listing shows the AVX-based (32-byte) sequence of memory accesses and the least significant 12 bits of their addresses for two different values of k.

======
k=0
======
load x+(0*64+0)*4  = x+0 where x is 4k aligned    0000 000|0 0000
load y+(0*64+0)*4  = y+0 where y is 4k aligned    0000 000|0 0000
store z+(0*64+0)*4 = z+0 where z is 4k aligned    0000 000|0 0000
load x+(0*64+8)*4  = x+32 where x is 4k aligned   0000 001|0 0000
load y+(0*64+8)*4  = y+32 where y is 4k aligned   0000 001|0 0000
store z+(0*64+8)*4 = z+32 where z is 4k aligned   0000 001|0 0000
load x+(0*64+16)*4 = x+64 where x is 4k aligned   0000 010|0 0000
load y+(0*64+16)*4 = y+64 where y is 4k aligned   0000 010|0 0000
store z+(0*64+16)*4= z+64 where z is 4k aligned   0000 010|0 0000
load x+(0*64+24)*4  = x+96 where x is 4k aligned  0000 011|0 0000
load y+(0*64+24)*4  = y+96 where y is 4k aligned  0000 011|0 0000
store z+(0*64+24)*4 = z+96 where z is 4k aligned  0000 011|0 0000
load x+(0*64+32)*4 = x+128 where x is 4k aligned  0000 100|0 0000
load y+(0*64+32)*4 = y+128 where y is 4k aligned  0000 100|0 0000
store z+(0*64+32)*4= z+128 where z is 4k aligned  0000 100|0 0000
.
.
.
======
k=1
======
load x+(0*64+0)*4  = x+0 where x is 4k aligned       0000 000|0 0000
load y+(0*64+0)*4  = y+0 where y is 4k+64 aligned    0000 010|0 0000
store z+(0*64+0)*4 = z+0 where z is 4k+128 aligned   0000 100|0 0000
load x+(0*64+8)*4  = x+32 where x is 4k aligned      0000 001|0 0000
load y+(0*64+8)*4  = y+32 where y is 4k+64 aligned   0000 011|0 0000
store z+(0*64+8)*4 = z+32 where z is 4k+128 aligned  0000 101|0 0000
load x+(0*64+16)*4 = x+64 where x is 4k aligned      0000 010|0 0000
load y+(0*64+16)*4 = y+64 where y is 4k+64 aligned   0000 100|0 0000
store z+(0*64+16)*4= z+64 where z is 4k+128 aligned  0000 110|0 0000
load x+(0*64+24)*4  = x+96 where x is 4k aligned     0000 011|0 0000
load y+(0*64+24)*4  = y+96 where y is 4k+64 aligned  0000 101|0 0000
store z+(0*64+24)*4 = z+96 where z is 4k+128 aligned 0000 111|0 0000
load x+(0*64+32)*4 = x+128 where x is 4k aligned     0000 100|0 0000
load y+(0*64+32)*4 = y+128 where y is 4k+64 aligned  0000 110|0 0000
store z+(0*64+32)*4= z+128 where z is 4k+128 aligned 0001 000|0 0000
.
.
.

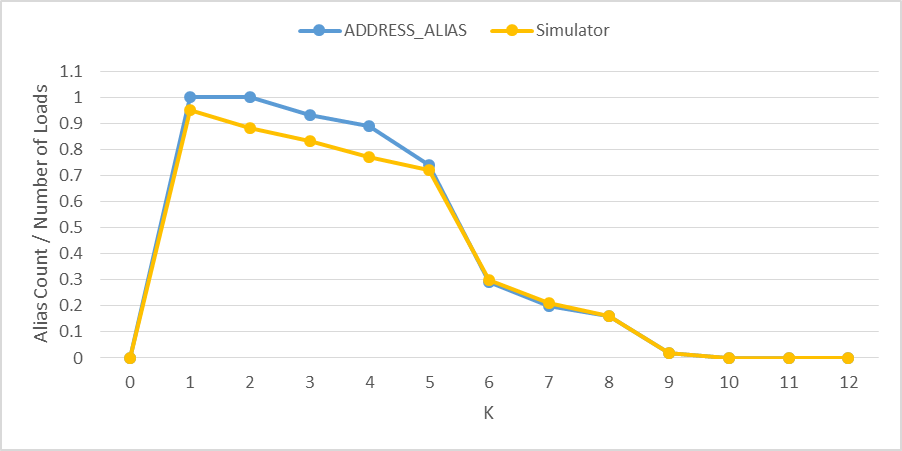
Note that when k=0, no load seem satisfy the two conditions of 4K aliasing. On the other hand, when k=1, all loads seem satisfy the conditions. However, it's tedious to do this manually for all iterations and all values of k. So I wrote a program that basically generates the addresses of the memory accesses and calculates the total number of loads that suffered 4K aliasing for different values of k. One issue I faced was that we don't know, for any given load, the number of stores that are still in the store buffer (have not been committed yet). Therefore, I've designed the simulator so that it can use different store throughputs for different values of k, which seems to better reflect what's actually happening on a real processor. The code can be found here.

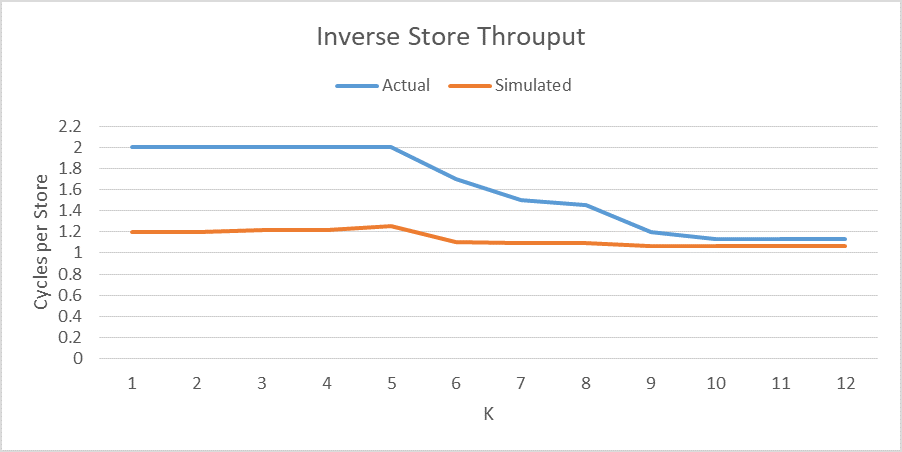
The following figure show the number of 4K aliasing cases produced by the simulator compared to the measured number using LD_BLOCKS_PARTIAL.ADDRESS_ALIAS on Haswell. I've tuned the store throughput used in the simulator for each value of k to make the two curves as similar as possible. The second figure shows the inverse store throughput (total cycles divided by total number of stores) used in the simulator and measured on Haswell. Note that the store throughput when k=0 doesn't matter because there is no 4K aliasing anyway. Since there are two loads for each store, the inverse load throughput is half of the inverse store throughput.

enter image description here

enter image description here

Obviously the amount of time each store remains in the store buffer is different on Haswell and the simulator, so I needed to use different throughputs to make the two curves similar. The simulator can be used to show how the store throughput can impact the number of 4K aliases. If the store throughput is very close to 1c/store, then the number of 4K aliasing cases would have been much smaller. 4K aliasing conditions don't result in pipeline flushes, but they may result in uop replays from the RS. In this particular case, I didn't observe any replays though.

I think I can explain these numbers if I assume that for k=1 that writes and reads cannot happen in the same clock cycle.

There is actually a penalty of a few cycles when executing a load and store at the same time, but they can only happen when the addresses of the load and store are within 64 bytes (but not equal) on Haswell or 32 bytes on Ivy Bridge and Sandy Bridge. Weird performance effects from nearby dependent stores in a pointer-chasing loop on IvyBridge. Adding an extra load speeds it up?. In this case, the addresses of all accesses are 32-byte aligned, but, on IvB, the L1 ports are all 16-byte in size, so the penalty can be incurred on Haswell and IvB. In fact, since loads and stores may take more time to retire and since there are more load buffers than store buffers, it's more likely that a later load will false-alias an earlier store. This raises the question, though, how the 4K alias penalty and the L1 access penalty interact with each other and contribute to the overall performance. Using the CYCLE_ACTIVITY.STALLS_LDM_PENDING event and the load latency performance monitoring facility MEM_TRANS_RETIRED.LOAD_LATENCY_GT_*, it seems to me that there is no observable L1 access penalty. This implies that most of the time the addresses of concurrent loads and stores don't induce the penalty. Hence, the 4K aliasing penalty is the main cause for bandwidth degradation.

I've used the following code to make measurements on Haswell. This is essentially the same code emitted by g++ -O3 -mavx.

%define SIZE 64*64*2
%define K_   10

BITS 64
DEFAULT REL

GLOBAL main

EXTERN printf
EXTERN exit

section .data
align 4096
bufsrc1: times (SIZE+(64*K_)) db 1
bufsrc2: times (SIZE+(64*K_)) db 1
bufdest: times SIZE db 1

section .text
global _start
_start:
    mov rax, 1000000

.outer:
    mov rbp, SIZE/256
    lea rsi, [bufsrc1]
    lea rdi, [bufsrc2]
    lea r13, [bufdest]

.loop:
    vmovaps ymm1, [rsi]
    vaddps  ymm0, ymm1, [rdi]

    add rsi, 256
    add rdi, 256
    add r13, 256

    vmovaps[r13-256], ymm0

    vmovaps  ymm2, [rsi-224]
    vaddps   ymm0, ymm2, [rdi-224]
    vmovaps  [r13-224], ymm0

    vmovaps  ymm3, [rsi-192]
    vaddps   ymm0, ymm3, [rdi-192]
    vmovaps  [r13-192], ymm0

    vmovaps  ymm4, [rsi-160]
    vaddps   ymm0, ymm4, [rdi-160]
    vmovaps  [r13-160], ymm0

    vmovaps  ymm5, [rsi-128]
    vaddps   ymm0, ymm5, [rdi-128]
    vmovaps  [r13-128], ymm0

    vmovaps  ymm6, [rsi-96]
    vaddps   ymm0, ymm6, [rdi-96]
    vmovaps  [r13-96], ymm0

    vmovaps  ymm7, [rsi-64]
    vaddps   ymm0, ymm7, [rdi-64]
    vmovaps  [r13-64], ymm0

    vmovaps  ymm1, [rsi-32]
    vaddps   ymm0, ymm1, [rdi-32]
    vmovaps  [r13-32], ymm0

    dec rbp
    jg .loop

    dec rax
    jg .outer

    xor edi,edi
    mov eax,231
    syscall 
Ehling answered 16/11, 2018 at 1:44 Comment(2)
Comments are not for extended discussion; this conversation has been moved to chat.Camenae
@BeeOnRope I thought that the z stream is 64-byte aligned, but it's actually 128-byte aligned. Now it's clear why both loads may alias previous stores. I've updated the whole answer.Ehling

© 2022 - 2024 — McMap. All rights reserved.