I am using Chart.js for drawing pie chart in my php page.I found tooltip as showing each slice values.

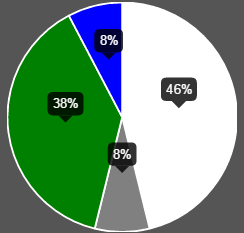
But I wish to display those values like below image. 
I do not know how to do this with chart.js.
Please help me.
My Javascript code:
function drawPie(canvasId,data,legend){
    var ctx = $("#pie-canvas-" + canvasId).get(0).getContext("2d");

    var piedata = [];
    $.each(data,function(i,val){
        piedata.push({value:val.count,color:val.color,label:val.status});
    });
    var options =
    {
        tooltipTemplate: "<%= Math.round(circumference / 6.283 * 100) %>%",
    }
    var pie = new Chart(ctx).Pie(piedata,options);
    if(legend)document.getElementById("legend").innerHTML = pie.generateLegend();
}
php code:
printf('<table><tr>');
echo '<td style="text-align: right;"><canvas id="pie-canvas-'
    . $canvasId
    . '" width="256" height="256" ></canvas></td><td style="text-align: left;width:360px;height:auto" id="legend" class="chart-legend"></td></tr></table>';

     echo '<script type="text/javascript">drawPie('
    . $canvasId
    . ', '
    . $data3
    .', '
    . $legend
    . ');</script>';


ctx.fillText()to do that, I don't think chart.js has direct support for doing that, but I may be wrong. – Anastasectx.fillText()and custom tool-tip.But still I didnt get.Can you please send some snippets from your try.? – RhfillText(). – Anastase