I have a react.js app that I want to profile for performance issues.
I'm using the react dev tool profiler in firefox.
I profile a specific interaction and get the flamegraph and the ranked time graph in the dev tool.
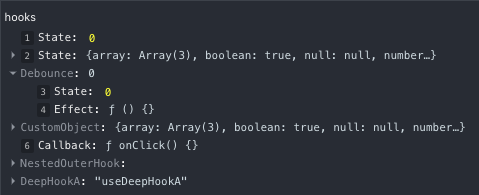
Then this message shows up in the dev tool:
This part of the dev tool is not interactive, and I can't find anything on how the hooks are numbered.
How do I interpret these numbers? What do they correspond to? Where can I find the information on what hooks they refer to?


