How to change the z-order of the plot elements in a seaborn pairplot
Asked Answered
A

2

8

Here is a snippet, to reproduce my example image:

import pandas as pd
import numpy as np
import seaborn as sns

np.random.seed(42)
df = pd.DataFrame(np.random.rand(10,2), columns=['x', 'y'])
df['label'] = ['cat', 'mouse', 'dog', 'mouse', 'cat', 'cat', 'mouse', 'mouse','dog', 'cat']
sns.pairplot(df, hue='label');

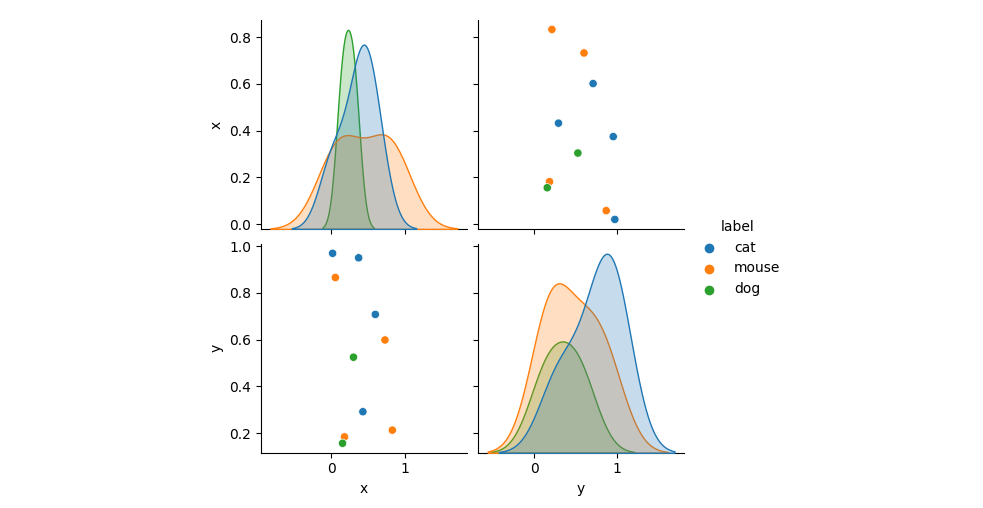
It produces the following seaborn pair plot, with some dummy data:

enter image description here

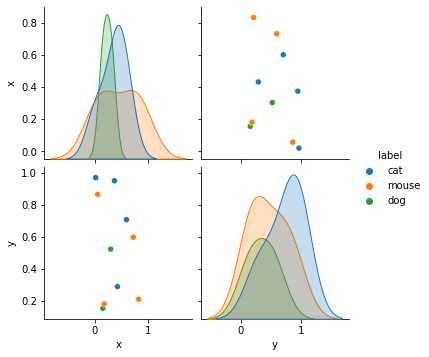
In the upper right plot, one marker of the 'dog' category is below an overlaying marker of the 'mouse' category.

Can I somehow change the z-order of the scatter plot markers, so that all markers of the 'dog' category are best visible on top?

edit: I already tried hue_order=['mouse', 'cat', 'dog'] and hue_order=['dog', 'mouse', 'cat'], but they only influence the order in the legend and the color. Not the z-order of the markers in the scatter plot.

Abstinence answered 7/1, 2022 at 14:1 Comment(3)
Did you try to sort your dataframe such that the dogs come last?Rusty
sns.pairplot(pd.concat([df[df['label'] != 'dog'], df[df['label'] == 'dog']]), hue='label') would be one way. The dots are plotted in the order they are encountered in the dataframe. Apart from that, the default hue order is the order the labels are encountered in the dataframe.Rusty
@Rusty this should've been posted as an answer. Now your code is being posted as an answer by another.Syllabic
R
4
  • This answer provides a full explanation of my comment from 2022-01-07.
  • The dots are drawn in the order they are encountered in the dataframe. You can change that order, e.g. via pd.concat([df[df['label'] != 'dog'], df[df['label'] == 'dog']]).
  • The order in the dataframe also sets the default order of the labels in the legend. Further note that in future seaborn versions this behavior might change.
import pandas as pd
import numpy as np
import seaborn as sns

np.random.seed(42)
df = pd.DataFrame(np.random.rand(10, 2), columns=['x', 'y'])
df['label'] = ['cat', 'mouse', 'dog', 'mouse', 'cat', 'cat', 'mouse', 'mouse', 'dog', 'cat']
sns.pairplot(pd.concat([df[df['label'] != 'dog'], df[df['label'] == 'dog']]), hue='label')

sns.pairplot changing order of dots

Rusty answered 26/6, 2022 at 22:42 Comment(0)
P
0

The dots are drawn in the order they are encountered as told by @JohanC in the question comment and the other answer. Concatenation is one option but for most of the cases sorting the dataframe may work.

df.sort_values(by=['foo', 'bar'], inplace=True)

If you wish to keep the original dataframe order then remove the inplace argument from the sort_values function and assign the returned sorted dataframe to a new variable.

Phosphaturia answered 14/2 at 5:15 Comment(0)

© 2022 - 2024 — McMap. All rights reserved.