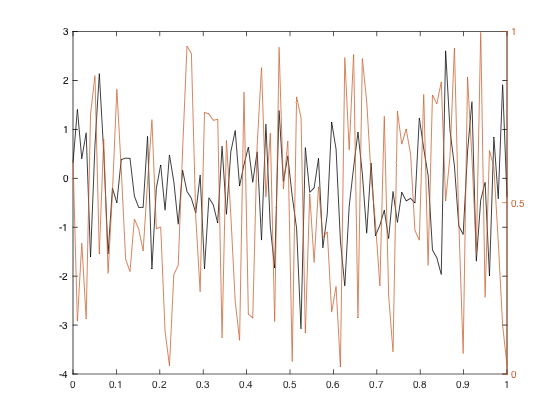
I am using Octave 4.2.1 portable under Win 10.
I have several plots in a single chart, with a single y axis, each one created with a plot(...) sentence.
I want to add a plot in a secondary y axis to this existing plot, not creating from the beginning the two axes with plotyy, (EDIT) and being able to work all the same, e.g., adding a legend, etc.
What is the correct usage for this?
If I execute
plotyy(x, ysec) ;
or
ax = gca ;
plotyy(ax, x, ysec) ;
I get
error: Invalid call to plotyy.  Correct usage is:
 -- plotyy (X1, Y1, X2, Y2)
 -- plotyy (..., FUN)
 -- plotyy (..., FUN1, FUN2)
 -- plotyy (HAX, ...)
 -- [AX, H1, H2] = plotyy (...)
This shows something similar for Matlab, but I am not sure all code that works with a secondary axis that would be created with plotyy, will work with an axis created this way as well.


plotyywith the data already in the axes and the new data. – Fully