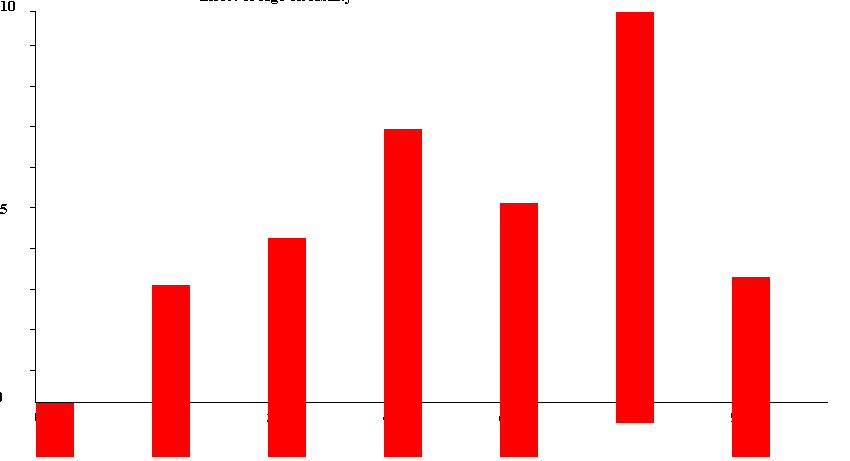
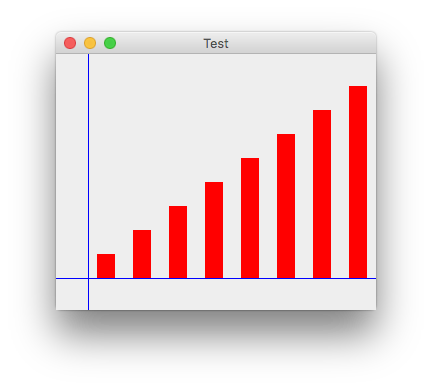
As you can see in the picture, the bars in the chart starts below the x-axis. How do I fix it so that it starts from the x-axis line? Please suggest me a fix and also I would be helpful to know where I am going wrong.
    private int PAD = 20;
private int LPAD = 35;
private int DPAD = 25;
Graphics2D g2 = (Graphics2D) g;

        g2.setColor(Color.BLACK);

        String DataString[] = dataset.split(", ");

        double DataArray[] = new double[DataString.length];

        double MaxValue = 0;
        int w = getWidth();
        int h = getHeight();

        for (int i = 0; i < DataString.length; i = i + 1) {

            try {

                double out = Double.parseDouble(DataString[i]);

                DataArray[i] = out;

                if (out > MaxValue) {

                    MaxValue = out;

                }


            } catch (NumberFormatException e) {

            }

        }

        double xScale = (w - 1 * (PAD + LPAD)) / (DataArray.length) - 1;
        double yScale = (h - 3 * DPAD) / MaxValue;
        // The initial x,y (0).
        int x0 = LPAD;

        try {
            if (DataArray.length > 1) {

                // Draw Graph
                g2.drawLine(PAD + LPAD, PAD, PAD + LPAD, h - (PAD + LPAD));
                g2.drawLine(PAD + LPAD, h - PAD - LPAD, x0 + (int) (DataArray.length * xScale), h - (PAD + LPAD));
                Color cd = new Color(135, 90, 185);
                g2.setPaint(cd);
                g2.drawString(title, w / 4, padding - 15);
                g2.drawString(xAxis, w / 2 - padding, h - (padding - 10));
                g2.rotate(Math.toRadians(270));
                g2.drawString(yAxis, -(h / 2 + padding) - LPAD, PAD - 5);
                g2.rotate(-Math.toRadians(270));

                g2.setPaint(Color.BLACK);
                double intin = Double.parseDouble(interval);
                double sin = Double.parseDouble(start);

                for (int j = 0; j < DataArray.length; j++) {

                    int x1 = x0 + (int) (j * xScale) + PAD;
                    double y1 = (int) ((MaxValue - DataArray[j]) * yScale + PAD) - 2;
                    // g2.drawLine(x1-3, (int) y1-3, x1+3, (int) y1+3);
                    // g2.drawLine(x1-3,(int) y1+3,x1+3,(int) y1-3);

                    // g2.drawLine(x1, h - (PAD + LPAD), x1, h - (PAD +
                    // LPAD)+5);

                    double intout = (sin + (intin * j));
                    String interval = String.valueOf(intout);

                    g2.drawString(interval, x1, h - LPAD);
                }

                for (int i = 0; i < 9; i++) {
                    int x3 = PAD + LPAD;
                    int x1 = x3 - 5;
                    int y0 = (h - (PAD)) - (((i + 1) * (h - PAD * 3)) / 10 + DPAD) - 2;
                    int y3 = y0;
                    g2.drawLine(x3, y0, x1, y3);
                }

                // g2.drawLine(PAD + LPAD, h - (PAD + LPAD), PAD + LPAD - 5,
                // h - (PAD + LPAD));
                g2.drawLine(PAD + LPAD, PAD, PAD + LPAD - 5, PAD);
                g2.drawString(start, LPAD - 20, h - (LPAD) - 20);

                Long L = Math.round(MaxValue);
                int MVi = Integer.valueOf(L.intValue());
                String MVstring = String.valueOf(MVi);
                int MVmid = MVi / 2;
                String MVmidstring = String.valueOf(MVmid);

                g2.drawString(MVmidstring, PAD, (h - PAD) / 2);
                g2.drawString(MVstring, PAD, PAD);


                g2.setColor(Color.red);
                for (int j = 0; j < DataArray.length; j++) {

                    int x1 = x0 + (int) (j * xScale) + PAD;
                    double y1 = (int) ((MaxValue - DataArray[j]) * yScale + PAD) - 2;
                    g2.fillRect(x1 + 2, (int) y1 + 1 , w - (PAD * 42), h);

                }

            }
        } catch (Exception e) {

        }
    }
    repaint();

}


How do I fix it so that it starts from the x-axis line.- you use basic math. We have no idea what your variables mean, so you need to do the math yourself. You need to know the "y offset" value of the "X Axis" line. Then you need to know the height of the bar. Then instead of drawing the rectangle below the "X Axis" line you want to draw it above, so the "y value" is equal to the "X Axis" y offset minus the height of the bar. – Connatural} catch (Exception e) { }Never do that. Instead change it to (at least, short of a proper logging implementation)} catch (Exception e) { e.printStackTrace(); // remove head from sand.. }– Housemother