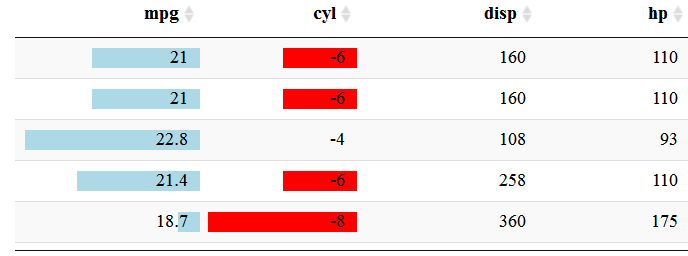
With styleColorBar, how can I get size of the color bar to be proportional to the absolute value of a column? In contrast to this, in the example below, looking at the cyl column, the red bar is larger for greater values.
Code:
data <- head(mtcars[,1:4])
data[,2] <- -data[,2]
data
out <- datatable(data, rownames = FALSE) %>%
  formatStyle('mpg',
              background = styleColorBar(data$mpg, 'lightblue'),
              backgroundSize = '95% 50%',
              backgroundRepeat = 'no-repeat',
              backgroundPosition = 'right') %>%
  formatStyle('cyl',
              background = styleColorBar(data$cyl, 'red'),
              backgroundSize = '95% 50%',
              backgroundRepeat = 'no-repeat',
              backgroundPosition = 'right')
out
Result:
 I am aware that very similar questions have been answered here and there.
But both examples seem more intricate than mine. The former deals with formatting a column based on another column. The latter has the direction of the color bar depend on the sign. I thought that perhaps a simpler trick exists for my case...
Thank you

