styleColorBar Center and shift Left/Right dependent on Sign
Asked Answered
M

1

17

I am looking to create bars that when using DT's datatable appear in the middle of the cells of a column and reach out left or right depending on whether the value in the cell is positive or negative.

I have tried using the function styleColorBar and changing the argument backgroundPosition to 'left' or 'center' however with each try the bars still appear to the right of the cell and always go to the left.

I can't find an example from R code, but have attached an example of what can be done on Excel; the colours aren't necessary but if included that would be a bonus.

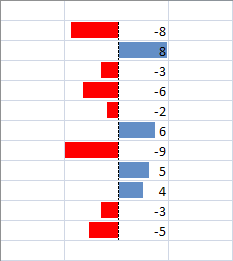
enter image description here

Mellifluent answered 4/11, 2015 at 12:22 Comment(2)
This is an interesting question but it lacks the effort the way it is presented. Please add a a reproducible example. You could add a minimal example where you used backgroundPosition = 'left' so that people can use it and try to find a solution. It is very unlikely that someone (including myself) will take the time to write the code that produces the situation described here and then try to find a solution...Dictatorial
I understand what I wrote wasn't easily understandable; have rewritten it so reads a bit better. Probably still not great but hopefully makes more sense than before!Mellifluent
C
33

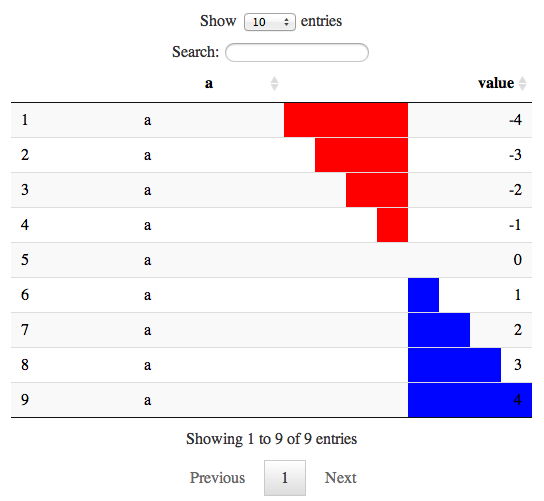
You could make a custom styleColorBar function that uses the CSS gradients (same as the original styleColorBar) to make the kind of bars you want.

Here is an example (sorry for the long line, adding new lines breaks the CSS):

color_from_middle <- function (data, color1,color2) 
{
  max_val=max(abs(data))
  JS(sprintf("isNaN(parseFloat(value)) || value < 0 ? 'linear-gradient(90deg, transparent, transparent ' + (50 + value/%s * 50) + '%%, %s ' + (50 + value/%s * 50) + '%%,%s  50%%,transparent 50%%)': 'linear-gradient(90deg, transparent, transparent 50%%, %s 50%%, %s ' + (50 + value/%s * 50) + '%%, transparent ' + (50 + value/%s * 50) + '%%)'",
             max_val,color1,max_val,color1,color2,color2,max_val,max_val))
} 

Using some test data:

data <- data.frame(a=c(rep("a",9)),value=c(-4,-3,-2,-1,0,1,2,3,4))

datatable(data) %>%
  formatStyle('value',
              background=color_from_middle(data$value,'red','blue'))

enter image description here

Clink answered 4/11, 2015 at 14:29 Comment(2)
Thank you so much, worked perfectly even for multiple columns!Mellifluent
Hi @NiceE, I was just wondering if you might know how to accomplish the very same thing in gt package. For more details, here my SO question #64443340Deceitful

© 2022 - 2024 — McMap. All rights reserved.