ios how to read a crash log
Asked Answered
D

3

8

I've never had to read a crash log before so I'm admittedly a n00b in these waters.

I can tell there was an EXC_BAD_ACCESS. How can I tell which object was released before it was supposed to be?

*note this happens after waking the device while the app is active. It doesn't always happen, but often enough.

** EDIT **

A symbolicated crash log:

Incident Identifier: 14FFD847-61CB-435B-9E98-C06B3B661429
CrashReporter Key:   7c5fd78cf04b38cfd2aa153f61eb1655ed671274
Hardware Model:      iPhone4,1
Process:         My iPhone App [2599]
Path:            /var/mobile/Applications/ABAB96ED-A203-48A5-8B50-B34BA3A8E4A4/My iPhone App.app/My iPhone App
Identifier:      My iPhone App
Version:         ??? (???)
Code Type:       ARM (Native)
Parent Process:  launchd [1]

Date/Time:       2012-07-01 22:17:43.458 -0600
OS Version:      iPhone OS 5.1 (9B179)
Report Version:  104

Exception Type:  EXC_BAD_ACCESS (SIGSEGV)
Exception Codes: KERN_INVALID_ADDRESS at 0xb4f05bbe
Crashed Thread:  0

Thread 0 name:  Dispatch queue: com.apple.main-thread
Thread 0 Crashed:
0   libobjc.A.dylib                 0x35a65f7e objc_msgSend + 22
1   UIKit                           0x33c31042 -[UIImageView isAnimating] + 130
2   UIKit                           0x33c3b100 -[UIImageView stopAnimating] + 96
3   UIKit                           0x33d5d1de -[UIActivityIndicatorView _tearDownAnimation] + 30
4   UIKit                           0x33cdb972 -[UIActivityIndicatorView _applicationDidEnterBackground:] + 34
5   Foundation                      0x37d8f4f8 __57-[NSNotificationCenter addObserver:selector:name:object:]_block_invoke_0 + 12
6   CoreFoundation                  0x37531540 ___CFXNotificationPost_block_invoke_0 + 64
7   CoreFoundation                  0x374bd090 _CFXNotificationPost + 1400
8   Foundation                      0x37d033e4 -[NSNotificationCenter postNotificationName:object:userInfo:] + 60
9   UIKit                           0x33c813f6 -[UIApplication _handleApplicationSuspend:eventInfo:] + 786
10  UIKit                           0x33c120a0 -[UIApplication handleEvent:withNewEvent:] + 2088
11  UIKit                           0x33c11708 -[UIApplication sendEvent:] + 48
12  UIKit                           0x33c110dc _UIApplicationHandleEvent + 5820
13  GraphicsServices                0x323c9224 PurpleEventCallback + 876
14  CoreFoundation                  0x3753951c __CFRUNLOOP_IS_CALLING_OUT_TO_A_SOURCE1_PERFORM_FUNCTION__ + 32
15  CoreFoundation                  0x375394be __CFRunLoopDoSource1 + 134
16  CoreFoundation                  0x3753830c __CFRunLoopRun + 1364
17  CoreFoundation                  0x374bb49e CFRunLoopRunSpecific + 294
18  CoreFoundation                  0x374bb366 CFRunLoopRunInMode + 98
19  GraphicsServices                0x323c8432 GSEventRunModal + 130
20  UIKit                           0x33c3fe76 UIApplicationMain + 1074
21  My iPhone App                   0x000f7ec2 0xdc000 + 114370
22  My iPhone App                   0x000ddc50 0xdc000 + 7248
Declension answered 2/7, 2012 at 17:13 Comment(2)
Check this thread- #1461392, after this you will be able to symbolise your crash logs, then it will be quite easy to understand.Maryjanemaryjo
@Maryjanemaryjo thanks - I added the new information to my questionDeclension
A
8

It needs to be symbolicated. Take a look at this post, it should help.

How to symbolicate iPhone \ iPad crash logs?

Andromache answered 2/7, 2012 at 17:27 Comment(3)
That makes a log more sense! I added the symbolicated version to my question.Declension
Looking at the log, it seems like your application is really crashing when going into the background as the device goes to sleep. You only see the effect when it wakes up. Do you have any cleanup code in the willEnterBackground: method (or the likes)?Andromache
nope. in fact the only callback that has any code is applicationDidBecomeActiveDeclension
L
2

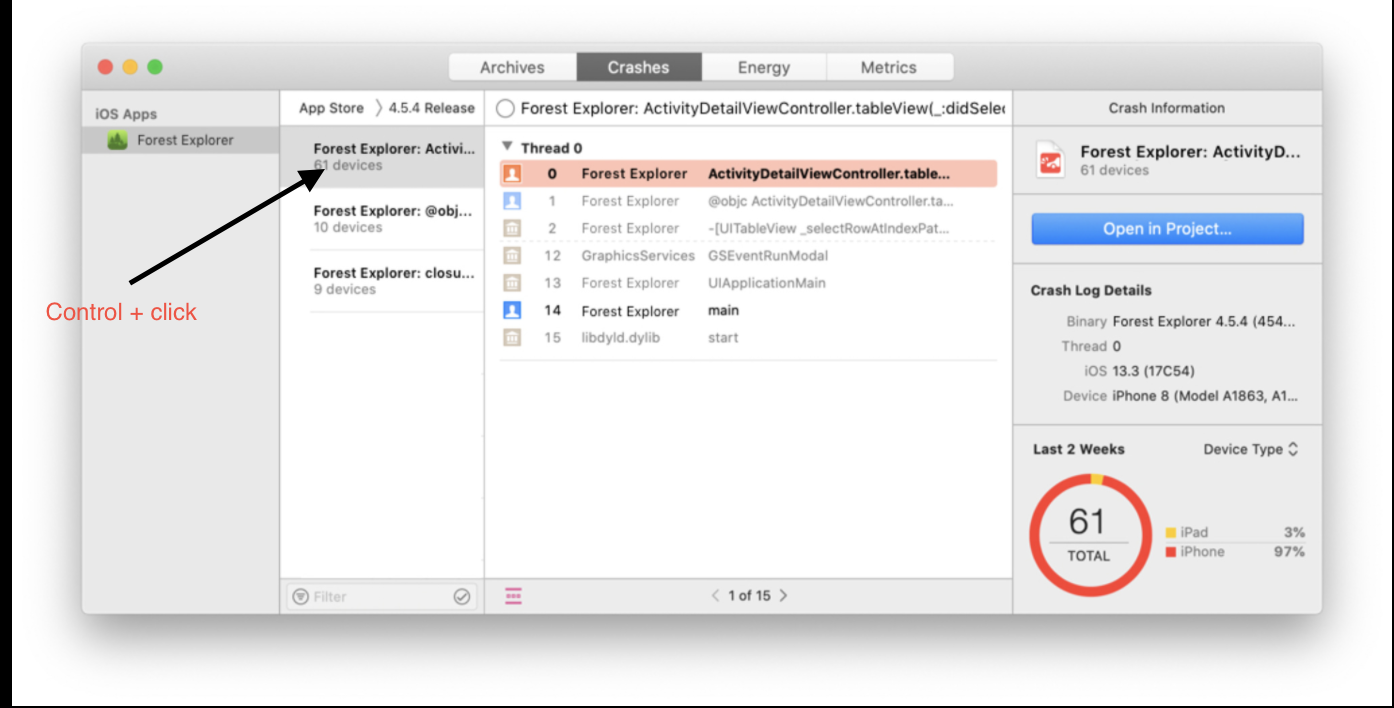
You can reach easily in a few steps.

  1. Open Xcode.
  2. Select Window from the menu bar.
  3. Go to Organizer > Crashes.
  4. Choose App Store from the drop down menu.

You can click to Open in Project button if you want to go directly code line.

If you wonder crash log in detail;

enter image description here enter image description here

  1. Control+Click on the crash in question.
  2. Choose Show in Finder.
  3. In the Finder window, control-click the highlighted .xccrashpoint file.
  4. Choose Show Package Contents.
  5. In the folder that displays, go to DistributionInfos > all > Logs.
Laine answered 10/11, 2021 at 7:49 Comment(0)
K
0

In this case, the process may have attempted to message a deallocated object, You had better profile the application with the Zombies instrument to better understand the conditions of this crash

https://developer.apple.com/library/archive/technotes/tn2151/_index.html This document is very good, which contains essential information about how to symbolicate, understand, and interpret crash reports.

Kathernkatheryn answered 31/5, 2020 at 10:31 Comment(0)

© 2022 - 2024 — McMap. All rights reserved.