Symbolicating iPhone App Crash Reports
Asked Answered
E

26

449

I'm looking to try and symbolicate my iPhone app's crash reports.

I retrieved the crash reports from iTunes Connect. I have the application binary that I submitted to the App Store and I have the dSYM file that was generated as part of the build.

I have all of these files together inside a single directory that is indexed by spotlight.

What now?

I have tried invoking:

symbolicatecrash crashreport.crash myApp.app.dSYM

and it just outputs the same text that is in the crash report to start with, not symbolicated.

Am I doing something wrong?

Enthrall answered 22/9, 2009 at 15:44 Comment(6)
You can also see my answer at iPhone SDK : Where is symbolicatecrash.sh located?. I list out where to find the symbolicatecrash command, how to use it, and how to find the dSYM file needed to do symbolication.Mascon
/Applications/Xcode.app/Contents/Developer/Platforms/iPhoneOS.platform/Developer/Library/PrivateFrameworks/DTDeviceKit.framework/Versions/A/Resources/symbolicatecrashWailful
I've created a script which may help: github.com/amleszk/scripts/blob/master/…Cristincristina
If anyone is wondering where can you get *.app, *.dSYM & crash logs to being with then look at my answer below.Ropy
Here's a very simple open source app for OS X that lets you simply drag a crash log and the corresponding .xcarchive (including dSYM) to symbolicate it: github.com/johnno1962/SymbolicateDoyenne
You can refer this : medium.com/@Mrugraj/crash-re-symbolication-5c28d3a3a883Bazil
G
698

Steps to analyze crash report from apple:

  1. Copy the release .app file which was pushed to the appstore, the .dSYM file that was created at the time of release and the crash report receive from APPLE into a FOLDER.

  2. OPEN terminal application and go to the folder created above (using cd command)

  3. Run atos -arch armv7 -o APPNAME.app/APPNAME MEMORY_LOCATION_OF_CRASH. The memory location should be the one at which the app crashed as per the report.

Ex: atos -arch armv7 -o 'APPNAME.app'/'APPNAME' 0x0003b508

This would show you the exact line, method name which resulted in crash.

Ex: [classname functionName:]; -510

Symbolicating IPA

if we use IPA for symbolicating - just rename the extention .ipa with .zip , extract it then we can get a Payload Folder which contain app. In this case we don't need .dSYM file.

Note

This can only work if the app binary does not have symbols stripped. By default release builds stripped the symbols. We can change it in project build settings "Strip Debug Symbols During Copy" to NO.

More details see this post

Glasshouse answered 10/2, 2011 at 8:44 Comment(18)
Just a tip to @NaveenShan answer, a real-world example would do this atos -o myApp.app/Contents/MacOS/myApp 0x0000000100001f2c and you get -[HUDWindow sizedHUDBackground] (in myApp) + 1197Narcotism
Which address do you use, though? The logs have two columns of addresses after each function, and the second has a + and an offset of some kind. Like 0x332da010 0x332d9000 + 4112.Blinny
@OscarGoldman The second address eg:- In 0x332da010 0x332d9000 + 4112. use 0x332d9000.Glasshouse
Didn't work. Maybe I don't have the right files to go with the crash report, idk.Glazer
@Glazer Is you try to symbolicate the IPA or Adhoc?Glasshouse
Also, if used without an address, it allow you to analyse multiple locations by submitting them one by one.Seventy
This is the only solution for me with Xcode 4.4. I have tried everything else with no luck, nothing symbolicates any other way...Erdman
There are multiple issues with this answer: 1. This can only work if the app binary does not have symbols stripped. And release builds by default do have them stripped. 2. Even if the symbols are available, it will never ever show the line number. Only symbolicating with the dSYM will provide that. 3. You cannot simply use the memory address shown in the stack trace, the address has to be normalized against the start memory address the app is loaded into. More details see this answer: #13575433Keesee
@Blinny you must use the first number, the second one is the base adress + offset (in decimal). Infact f.e. I have this numbers com.myApp 0x000000010001dc66 0x100000000 + 121958 and if you translate 121958 in esadecimal it is 1dc66. Btw if you go more down the log to Binary Images section, in my case, there will be 0x100000000 - 0x100244ff7 +com.myApp that indicates the range of addresses that are part of my application.Labionasal
I am not seeing expected result..atos -arch armv7 -o 'MobileApp.app'/'MobileApp' 0x68000 Result: 0x00068000 (in MobileApp) + 328... (lot of information here huh!!) I am using enterprise distributed ipa.Procurer
@Akki, Are you sure you are using the same IPA in which crash occurred?Glasshouse
Yes, I am using the same ipa. I extracted .app from it and copied in the folder with .crash and .dsym file.Procurer
@NaveenShan I have traced the UUID too. .app and .crash have same uuid.Procurer
Probably related to what Kerni said, but the approach described in this answer gives completely different results than symbolicatecrash when you cross-reference the two. For instance, in symbolicatecrash I get 'InspectionViewController.m:2170', while using the same address with the technique in this answer gives 'AFHTTPClient.m:1220'. Clearly one or the other is wrong.Mixtec
I've written a tool for symbolication, which looks through all your xarchives trying to symbolicate a crashlog. github.com/soniccat/symbLever
If you need to manually do this (like from a screenshot of a crashlog), use the -l tag described in this answer: https://mcmap.net/q/81580/-ios-crash-reports-atos-not-working-as-expected It does the math for you.Carrycarryall
Damn, Apple has this much documentation developer.apple.com/library/content/technotes/tn2151/… when your simple answer solves 90% of the people that would have read Apple's page.Careerist
I hate Apple with a passion.Kandrakandy
M
178

After reading all these answers here in order to symbolicate a crash log (and finally succeeding) I think there are some points missing here that are really important in order to determine why the invocation of symbolicatecrash does not produce a symbolicated output.

There are 3 assets that have to fit together when symbolicating a crash log:

  1. The crash log file itself (i.e. example.crash), either exported from XCode's organizer or received from iTunes Connect.
  2. The .app package (i.e. example.app) that itself contains the app binary belonging to the crash log. If you have an .ipa package (i.e. example.ipa) then you can extract the .app package by unzipping the .ipa package (i.e. unzip example.ipa). Afterwards the .app package resides in the extracted Payload/ folder.
  3. The .dSYM package containing the debug symbols (i.e. example.app.dSYM)

Before starting symbolication you should check if all those artifacts match, which means that the crash log belongs to the binary you have and that the debug symbols are the ones produced during the build of that binary.

Each binary is referred by a UUID that can be seen in the crash log file:

...
Binary Images:
0xe1000 -    0x1f0fff +example armv7  <aa5e633efda8346cab92b01320043dc3> /var/mobile/Applications/9FB5D11F-42C0-42CA-A336-4B99FF97708F/example.app/example
0x2febf000 - 0x2fedffff  dyld armv7s  <4047d926f58e36b98da92ab7a93a8aaf> /usr/lib/dyld
...

In this extract the crash log belongs to an app binary image named example.app/example with UUID aa5e633efda8346cab92b01320043dc3.

You can check the UUID of the binary package you have with dwarfdump:

dwarfdump --uuid example.app/example
UUID: AA5E633E-FDA8-346C-AB92-B01320043DC3 (armv7) example.app/example

Afterwards you should check if the debug symbols you have also belong to that binary:

dwarfdump --uuid example.app.dSYM
UUID: AA5E633E-FDA8-346C-AB92-B01320043DC3 (armv7) example.app.dSYM/Contents/Resources/DWARF/example

In this example all assets fit together and you should be able to symbolicate your stacktrace.

Proceeding to the symbolicatecrash script:

In Xcode 8.3 you should be able to invoke the script via

/Applications/Xcode.app/Contents/SharedFrameworks/DVTFoundation.framework/Versions/A/Resources/symbolicatecrash -v example.crash 2> symbolicate.log

If it is not there you may run a find . -name symbolicatecrash in your Xcode.app directory to find it.

As you can see there are no more parameters given. So the script has to find your application binary and debug symbols by running a spotlight search. It searches the debug symbols with a specific index called com_apple_xcode_dsym_uuids. You can do this search yourself:

mdfind 'com_apple_xcode_dsym_uuids = *'

resp.

mdfind "com_apple_xcode_dsym_uuids == AA5E633E-FDA8-346C-AB92-B01320043DC3"

The first spotlight invocation gives you all indexed dSYM packages and the second one gives you the .dSYM packages with a specific UUID. If spotlight does not find your .dSYM package then symbolicatecrash will neither. If you do all this stuff e.g. in a subfolder of your ~/Desktop spotlight should be able to find everything.

If symbolicatecrash finds your .dSYM package there should be a line like the following in symbolicate.log:

@dsym_paths = ( <SOME_PATH>/example.app.dSYM/Contents/Resources/DWARF/example )

For finding your .app package a spotlight search like the following is invoked by symbolicatecrash:

mdfind "kMDItemContentType == com.apple.application-bundle && (kMDItemAlternateNames == 'example.app' || kMDItemDisplayName == 'example' || kMDItemDisplayName == 'example.app')"

If symbolicatecrash finds your .app package there should be the following extract in symbolicate.log:

Number of symbols in <SOME_PATH>/example.app/example: 2209 + 19675 = 21884
Found executable <SOME_PATH>/example.app/example
-- MATCH

If all those resources are found by symbolicatecrash it should print out the symbolicated version of your crash log.

If not you can pass in your dSYM and .app files directly.

symbolicatecrash -v --dsym <SOME_PATH>/<App_URI>.app.dSYM/<APP_NAME>.app.dsym <CRASHFILE> <SOME_OTHER_PATH>/<APP_NAME>.app/<APP_NAME> > symbolicate.log

Note: The symbolicated backtrace will be output to terminal, not symbolicate.log.

Mckay answered 2/12, 2012 at 12:47 Comment(8)
i can find all the files however i get this, and no symbolicated output No crash report version in testlog.crash at /usr/bin/symbolicatecrash line 921.Delineator
This was really helpful! In my case the .app file has different name than the executable name (I do not know why but it is built this way by Xcode). After renaming .app file in the XCode archive, the symbolicating did work.Biracial
This is a great explanation and should be the top answer IMO, thank you. Note that you may have to set your DEVELOPER_DIR environment variable if the script complains about it like so: export DEVELOPER_DIR=`xcode-select --print-path` . I added this line to my ~/.bash_profile. See https://mcmap.net/q/81581/-trying-to-get-symbols-for-an-ios-crash-file/350761Spruik
There is an app in appstore that I found, that helps to find and symbolicate crash logs. itunes.apple.com/us/app/symbolicator/id705354958?ls=1&mt=12Tropical
Note that for Xcode 5, this has moved to: <PATH_TO_Xcode.app>/Contents/Developer/Platforms/iPhoneOS.platform/Developer/Library/PrivateFrameworks/DTDeviceKitBase.framework/Versions/Current/Resources/symbolicatecrashSpruik
symbolicate crash also has several helpful options. <SYMBOL_PATH> Additional search paths in which to search for symbol rich binaries -o | --output <OUTPUT_FILE> The symbolicated log will be written to OUTPUT_FILE. Defaults to "-" (i.e. stdout) if not specified -d | --dsym <DSYM_BUNDLE> Adds additional dSYM that will be consulted if and when a binary's UUID matches (may be specified more than once)Linnell
I can't, for the life of me, seem to get this to work...my .app and .dSYM file are in the same directory, from which I'm running 'symbolicatecrash', but the output (both to terminal and log file) is simply blank. Anyone encountered this? I also tried specifying the app and .dsym manually, same result.Parimutuel
Regarding his step "You can check the UUID of the binary package you have with dwarfdump:" If your app has a space in name then your dwarfdump would look like this: "$ dwarfdump --uuid 'Your Appname.app'/Your_Appname" In the second part it replaces the space with an underscore.Orthicon
C
115

With the latest version of Xcode (3.2.2), you can drag and drop any crash reports into the Device Logs section of the Xcode Organiser and they will automatically by symbolicated for you. I think this works best if you built that version of the App using Build & Archive (also part of Xcode 3.2.2)

Crandale answered 20/4, 2010 at 6:33 Comment(10)
This is simply not working with Xcode4, on a fresh install. Seems to be a new bug :(Fredra
I'm not sure if this solves the same problem you have, but someone has patched the symbolicate script github.com/nskboy/symbolicatecrash-fix YMMV :)Crandale
I had some partial success with that script; it failed on approx 50% of the Apple library calls though, reported lots of errors along the lines of "armv7 architecture not found". With Xcode 3.x, I'd get symbolication on 99% of calls.Fredra
This tip works with Xcode 4.2. Place crashlogs in Device Logs of Organizer. Restart the Organizer will get symbolicated crash logs !!! Thanks.Highly
This didn't work from me when I imported an archive file from another computer to get a crash log. :( For this reason I had to manually symbolicate the file. You can find steps on how to do the symbolication here: iPhone SDK : Where is symbolicatecrash.sh located?Mascon
Make sure the first line in your crash report is... Incident Identifier: 12345 (where 12345 is a random string of numbers) otherwise XCode wont let you import it. I was using CrashReporter.framework and it was generating the first line as Incident Identifier: [TODO] and that was causing XCode to reject itContention
Don't work for me with downloaded crash reports from iTunes Connect.Resistless
Works great with XCode 5.1 This is much simpler than using the terminal.Weariless
For people that have the same problem as @Altaveron - Symbolicating a crash log requires the system files from a similar device running the same system version as the crash log. Check the iOS version (e.g. 7.1.2 (11D257)) from which the crash log comes, and plug in a device in Xcode that has that same version, so Xcode can extract the symbols. You can check if you have the correct symbols in ~/Library/Developer/Xcode/iOS DeviceSupport/Redaredact
This doesn't work with iTunes Connect which is asked in the question.Thissa
C
75

I did this successfully, using the following steps.

Step 1: Create a folder in desktop, I give name it to "CrashReport" and put three files ("MYApp.app", "MyApp.app.dSYM", "MYApp_2013-07-18.crash") in it.

Step 2: Open Finder and go to Applications, where you will find the Xcode application, right click on this and Click "Show Package Contents", after this follow this simple path. "Contents->Developer->Platforms->iPhoneOS.platform->Developer->Library->PrivateFrameworks->DTDeviceKit.framework->Versions->A->Resources"

OR

"Contents->Developer->Platforms->iPhoneOS.platform->Developer->Library->PrivateFrameworks->DTDeviceKitBase.framework->Versions->A->Resources"

OR

For Xcode 6 and above the path is Applications/Xcode.app/Contents/SharedFrameworks/DTDeviceKitBase.framework/Versions/A/Resources

Where you find "symbolicatecrash" file, copy this and paste it to "CrashReport" folder.

Step 3: launch the terminal, run these 3 Command

  1. cd /Users/mac38/Desktop/CrashReport and press Enter button

  2. export DEVELOPER_DIR="/Applications/Xcode.app/Contents/Developer" and press Enter

  3. ./symbolicatecrash -A -v MYApp_2013-07-18.crash MyApp.app.dSYM and press Enter Now its Done.. (NOTE: versions around 6.4 or later do not have the -A option -- just leave it out).
Counterclockwise answered 19/7, 2013 at 13:50 Comment(3)
for DTServiceKit look in Applications/Xcode.app/Contents/SharedFrameworksEhrenberg
Thank Thank you... as of April 9, 2015, this is what worked for me flawlessly. One thing, is that I got Unknown option: A for symbolicatecrash, but the process ran anywayCanady
I wish I could give a thousand points to this answer. There are so many how-to's on this topic... but this is the one that works at the lowest level so it ALWAYS works. It's a pain in the rear to hit all the steps, but when everything else fails, this does the job.Lansquenet
C
37

Steps to symbolicate a crash report automatically using XCode:

UPDATED FOR XCODE 9

  1. Connect any iOS device to your Mac (yes a physical one, yes I know this is stupid)

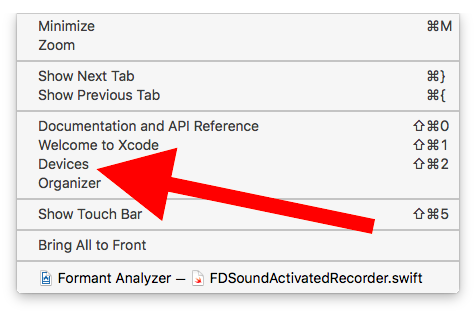
  2. Choose "Devices" from the "Window" menu enter image description here

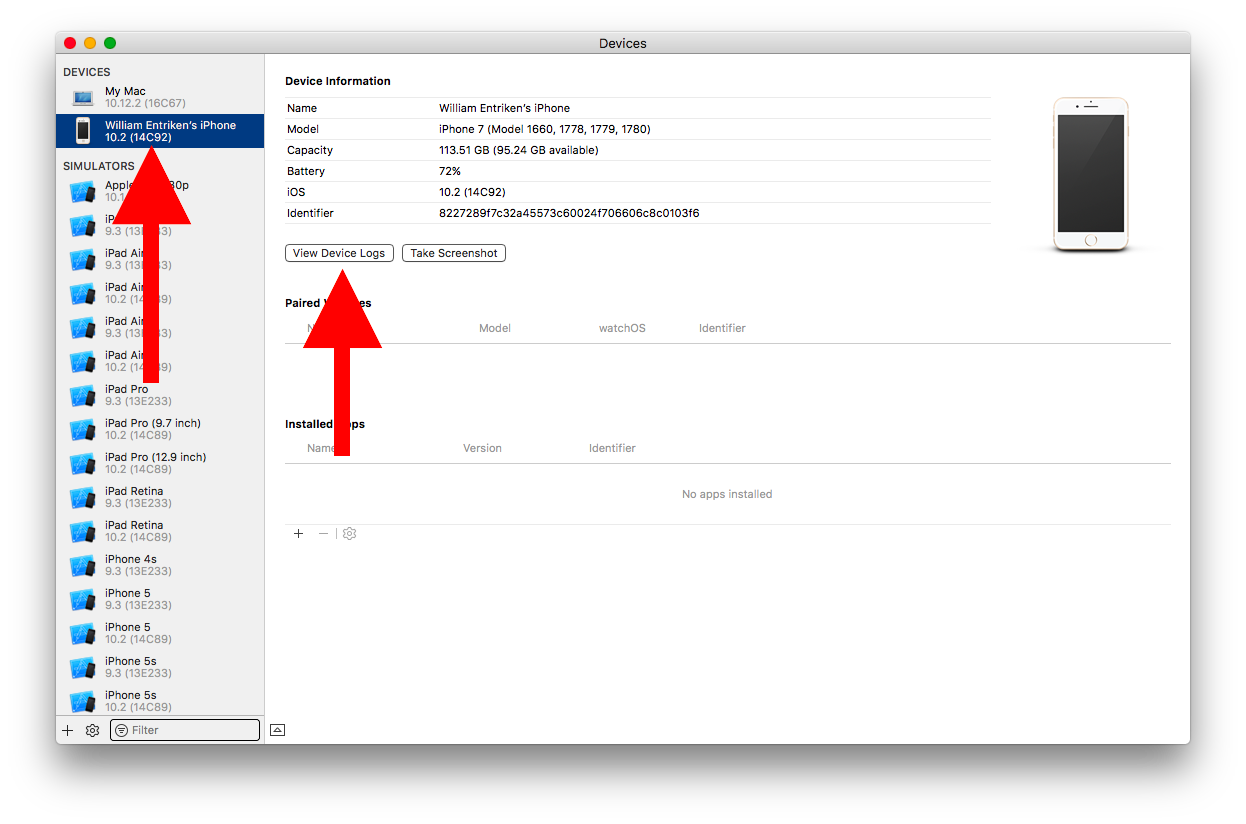
  3. Click your device on the left and VIEW DEVICE LOGS on the right enter image description here

  4. Wait. It might take a minute to show up. Maybe doing Command-A then Delete will speed this up.

  5. Critical undocumented step: rename the crash report that you got from iTunesConnect from .txt extension to .crash extension

  6. Drag the crash report into that area on the left enter image description here

And then Xcode will symbolicate the crash report and display the results.

Source: https://developer.apple.com/library/ios/technotes/tn2151/_index.html

Careerist answered 23/6, 2016 at 3:54 Comment(4)
This is the official Apple procedure. Should be the answer.Variegation
Thank you, I'm adding pictures now. Also included the SUPER UNDOCUMENTED step. I thought about make a git of red text and splicing it in there so that it would really stand out. Then I stopped thinking about that.Careerist
Thank you! None of the other answers actually say that the device you use does not need to be the device (or even device type) that the crash occurred on.Riboflavin
Quick note, because for me it would not re-symbolicate. I had to also open Organizer, click the build in Archives, click Download Debug Symbols. Then I could re-symbolicate in the device log view. This was for a crash log downloaded from Apple after a rejected review.Lambaste
L
28

I also put dsym, app bundle, and crash log together in the same directory before running symbolicate crash

Then I use this function defined in my .profile to simplify running symbolicatecrash:

function desym
{
    /Developer/Platforms/iPhoneOS.platform/Developer/Library/PrivateFrameworks/DTDeviceKit.framework/Versions/A/Resources/symbolicatecrash -A -v $1 | more
}

The arguments added there may help you.

You can check to make sure spotlight "sees" your dysm files by running the command:

mdfind 'com_apple_xcode_dsym_uuids = *'

Look for the dsym you have in your directory.

NOTE: As of the latest Xcode, there is no longer a Developer directory. You can find this utility here:

/Applications/Xcode.app/Contents/SharedFrameworks/DTDeviceKitBase.framework/Vers‌​ions/A/Resources/symbolicatecrash

Lollard answered 22/9, 2009 at 21:18 Comment(7)
I looked at the mdfind output, and the dSYM file can definitely be seen by spotlight. However, the symbolicatecrash script still doesn't output anything different from the crash report itself. Even using the arguments you provided.Enthrall
The script should produce some warning text at the beginning if it cannot find the dsym - can you look for that and see what it says?Lollard
Also, try adding "." after the command, so it would be "symbolicatecrash -A -v MyApp.crashlog ." . That forces it to look in the current directory if it's not doing so already.Lollard
Meaning "Can't exec "/usr/bin/xcode-select": No such file or directory at /Developer/Platforms/iPhoneOS.platform/Developer/Library/Xcode/Plug-ins/iPhoneRemoteDevice.xcodeplugin/Contents/Resources/symbolicatecrash line 49."Bekelja
Oops, apparently there is another SO question for that #1860352Bekelja
This did not directly work. But this did: #7676363Diatomite
Since Xcode 6, symbolicatecrash is located here : /Applications/Xcode.app/Contents/SharedFrameworks/DTDeviceKitBase.framework/Versions/A/Resources/symbolicatecrashCleopatra
I
28

I use Airbrake in my apps, which does a fairly good job of remote error logging.

Here's how I symbolicate them with atos if the backtrace needs it:

  1. In Xcode (4.2) go to the organizer, right click on the archive from which the .ipa file was generated.

  2. In Terminal, cd into the xcarchive for instance MyCoolApp 10-27-11 1.30 PM.xcarchive

  3. Enter the following atos -arch armv7 -o 'MyCoolApp.app'/'MyCoolApp' (don't forget the single quotes)

  4. I don't include my symbol in that call. What you get is a block cursor on an empty line.

  5. Then I copy/paste my symbol code at that block cursor and press enter. You'll see something like:

    -[MyCoolVC dealloc] (in MyCoolApp) (MyCoolVC.m:34)

  6. You're back to a block cursor and you can paste in other symbols.

Being able to go through your backtrace one item without re-entering the first bit is a nice time saver.

Enjoy!

Infinite answered 27/10, 2011 at 21:6 Comment(0)
B
21

Just a simple and updated answer for xcode 6.1.1 .

STEPS

1.Xcode>Window>Devices.

2.Select a device from a list of devices under DEVICES section.

3.Select View Device Logs.

4.Under the All Logs section you can directly drag drop the report.crash

5.Xcode will automatically Symbolicate the crash report for you.

6.You can find the Symbolicated crash report by matching its Date/Time with the Date/Time mentioned in your crash report.

Bah answered 2/2, 2015 at 14:45 Comment(3)
Crash reports which I have downloaded from Apple Resolution Center usually have extension of .txt. Remember to rename them to .crash, otherwise Device Logs may refuse to add them. Work well for my current XCode 6.3.1Neolamarckism
This is the official Apple procedure. Should be the answer. Apple link: Technical Note TN2151: Understanding and Analyzing iOS Application Crash ReportsVariegation
How do we do this if the crash came from Apple/ iTunesConnect? So in other words we don't actually know or have the device that the crash occurred on?Riboflavin
R
14

Even though I had been developing apps for a few years now, this was my first time debugging a binary and I felt like a complete NOOB figuring out where all the files were i.e. where is *.app *.dSYM and crash logs? I had to read multiple posts in order to figure it out. Picture is worth a thousand words and I hope this post helps anyone else in future.

1- First go to itunesconnect and download your crash logs. NOTE: Is most cases you may get something like "Too few reports have been submitted for a report to be shown." Basically not enough users have submitted crash log reports to Apple in which case you can't do much of anything at that point.

enter image description here

enter image description here

2- Now if you had not changed your code since you had submitted your binary it to Apple then Launch Xcode for that project and do Product --> Archive again. Otherwise just find your latest submitted binary and right click on it.

enter image description here

enter image description here

enter image description here

enter image description here

Ropy answered 6/7, 2014 at 19:13 Comment(0)
C
8

Using Xcode 4, the task is even simpler:

  • open Organizer,
  • click on Library | Device Log in the left column
  • click on "Import" button on the bottom of the screen...

and voilà. The log file is imported and Symbolized automatically for you. Provided you Archived the build using Xcode -> Product -> Archive first.

Chymotrypsin answered 14/6, 2011 at 18:21 Comment(1)
Strange enough, importing has no effect. Putting .app, .dSYM and .crash and then running symbolicatecrash on .crash file (without any additional arguments) worked though (XCode 4)Clearance
B
8

In Xcode 4.2.1, open Organizer, then go to Library/Device Logs and drag your .crash file into the list of crash logs. It will be symbolicated for you after a few seconds.

Note that you must use the same instance of Xcode that the original build was archived on (i.e. the archive for your build must exist in Organizer).

Bridle answered 27/1, 2012 at 17:52 Comment(0)
L
7

The magical Xcode Organizer isn't that magical about symbolicating my app. I got no symbols at all for the crash reports that I got back from Apple from a failed app submission.

I tried using the command-line, putting the crash report in the same folder as the .app file (that I submitted to the store) and the .dSYM file:

$ symbolicatecrash "My App_date_blahblah-iPhone.crash" "My App.app"

This only provided symbols for my app and not the core foundation code, but it was better than the number dump that Organizer is giving me and was enough for me to find and fix the crash that my app had. If anyone knows how to extend this to get Foundation symbols it would be appreciated.

Lakes answered 12/10, 2010 at 15:6 Comment(1)
For core Foundation dSYM, a (may be chinese) guy out there had uploaded the dSYM on his shared google drive, just download it and throw in to "devices supported" folder and it will be solved. github.com/Zuikyo/iOS-System-SymbolsMckinleymckinney
T
6

In my case, I was dragging crash reports directly from Mail to the Organizer. For some reason, that prevented the crash reports from getting symbolicated (I'd love to know why).

Copying the crash reports to the Desktop first, and then dragging them from there to the Organizer got them symbolicated properly.

Very specific case, I know. But thought I'd share just in case.

Teryn answered 5/4, 2011 at 3:10 Comment(1)
I imagine this may have something to do with spotlight. Is there any chance the location where the organizer keeps your logs wasn't being indexed by spotlight?Enthrall
B
4

Here's another issue I have with symbolicatecrash – it won't work with Apps that have spaces in their bundle (i.e. 'Test App.app'). Note I don't think you can have spaces in their name when submitting so you should remove these anyway, but if you already have crashes that need analysing, patch symbolicatecrash (4.3 GM) as such:

240c240
<         my $cmd = "mdfind \"kMDItemContentType == com.apple.application-bundle && kMDItemFSName == $exec_name.app\"";
---
>         my $cmd = "mdfind \"kMDItemContentType == com.apple.application-bundle && kMDItemFSName == '$exec_name.app'\"";
251c251
<             my $cmd = "find \"$archive_path/Products\" -name $exec_name.app";
---
>             my $cmd = "find \"$archive_path/Products\" -name \"$exec_name.app\"";
Beauvoir answered 7/3, 2011 at 13:2 Comment(1)
For what it's worth, I filled a rdar on this and it's fixed in [redacted]Beauvoir
L
4

For those using Airbrake, there's a solid response above but it wouldn't work for me without tweaking:

Works for some memory addresses but not others, not sure why...

  • Create new dir on desktop or wherever
  • Find archive in question in Xcode organizer
  • Double tap to reveal in finder
  • Double tap to show bundle contents
  • Copy .dSYM file and .app file into new dir
  • cd into new dir
  • Run this command: atos -arch armv7 -o 'Vimeo.app'/'Vimeo'
  • Terminal will enter an interactive move
  • Paste in memory address and hit enter, it will output method name and line number
  • Alternatively, enter this command: atos -arch armv7 -o 'Vimeo.app'/'Vimeo' To get info for one address only
Lorri answered 10/1, 2012 at 20:59 Comment(0)
L
4

The combination that worked for me was:

  1. Copy the dSYM file into the directory where the crash report was
  2. Unzip the ipa file containing the app ('unzip MyApp.ipa')
  3. Copy the application binary from the resulting exploded payload into the same folder as the crash report and symbol file (Something like "MyApp.app/MyApp")
  4. Import or Re-symbolicate the crash report from within Xcode's organizer

Using atos I wasn't able to resolve the correct symbol information with the addresses and offsets that were in the crash report. When I did this, I see something more meaningful, and it seems to be a legitimate stack trace.

Lowbred answered 2/11, 2012 at 15:50 Comment(0)
B
3

I had to do a lot of hacking of the symbolicatecrash script to get it to run properly.

As far as I can tell, symbolicatecrash right now requires the .app to be in the same directory as the .dsym. It will use the .dsym to locate the .app, but it won't use the dsym to find the symbols.

You should make a copy of your symbolicatecrash before attempting these patches which will make it look in the dsym:

Around line 212 in the getSymbolPathFor_dsymUuid function

212     my @executablePath = grep { -e && ! -d } glob("$dsymdir" . "/Contents/Resources/DWARF/" . $executable);

Around line 265 in the matchesUUID function

265             return 1;
Bk answered 26/1, 2010 at 19:43 Comment(0)
U
2

This is simple, after searching a lot i found clear steps to symbolicate whole crash log file.

  • copy .app , crash_report and DSYM files in a folder.
  • connect the device with xcode
  • Then go to window -> select devices -> view device logs
  • Then select this device, delete all logs .
  • drag and drop your crash on device log section . it will automatically symbolicate the crash . just right click on report and export it .

happy coding,
Riyaz

Understand answered 15/2, 2017 at 6:24 Comment(1)
best short and sweet ans, follow each and every step written in this ans . developer.apple.com/library/content/technotes/tn2151/… follow this link to find the difference between unsymbolicated and fully symbolicated.Deyoung
P
1

I prefer a script that will symbolicate all my crash logs.

Preconditions

Create a folder and put there 4 things:

  1. symbolicatecrash perl script - there are many SO answers that tells it's location

  2. The archive of the build that match the crashes (from Xcode Organizer. simple as Show in Finder and copy) [I don't sure this is necessery]

  3. All the xccrashpoint packages - (from Xcode Organizer. Show in Finder, you may copy all the packages in the directory, or the single xccrashpoint you would like to symbolicate)

  4. Add that short script to the directory:

    #!/bin/sh
    
    echo "cleaning old crashes from directory"
    rm -P *.crash
    rm -P *.xccrashpoint
    rm -r allCrashes
    echo "removed!"
    echo ""
    echo "--- START ---"
    echo ""
    
    mkdir allCrashes
    mkdir symboledCrashes
    find `ls -d *.xccrashpoint` -name "*.crash" -print -exec cp {} allCrashes/ \;
    
    cd allCrashes
    for crash in *.crash; do
        ../symbolicatecrash $crash > ../symboledCrashes/V$crash
    done
    cd ..
    
    echo ""
    echo "--- DONE ---"
    echo ""
    

The Script

When you run the script, you'll get 2 directories.

  1. allCrashes - all the crashes from all the xccrashpoint will be there.

  2. symboledCrashes - the same crashes but now with all the symbols.

  3. you DON'T need to clean the directory from old crashes before running the script. it will clean automatically. good luck!

Polysyndeton answered 7/5, 2017 at 6:2 Comment(0)
M
1

I found out most of proposed alternatives did not work in latest XCode (tested with Xcode 10). For example, I had no luck drag-dropping .crash logs in Xcode -> Organizer -> Device logs -view.

I recommend using Symbolicator tool https://github.com/agentsim/Symbolicator

  • Git clone Symbolicator repository and compile and run with Xcode
  • Copy .crash file (ascii file, with stack trace in begging of file) and .xarchive of crashing release to same temporarly folder
  • Drag and drop .crash file to Symbolicator icon in Dock
  • In 5-30 secs symbolicated crash file is produced in same folder as .crash and .xarchive are
Malvie answered 20/11, 2018 at 10:31 Comment(0)
C
0

In order to symbolicate crashes, Spotlight must be able to find the .dSYM file that was generated at the same time the binary you submitted to Apple was. Since it contains the symbol information, you will be out of luck if it isn't available.

Cal answered 22/9, 2009 at 20:51 Comment(1)
If you read the question, I stated that I have saved the original dSYM file that was generated at the same time the binary was submitted.Enthrall
M
0

I got a bit grumpy about the fact nothing here seems to "just work" so I did some investigating and the result is:

Set up: QuincyKit back end that receives reports. No symbolication set up as I couldn't even begin to figure out what they were suggesting I do to make it work.

The fix: download crash reports from the server online. They're called 'crash' and by default go into the ~/Downloads/ folder. With that in mind, this script will "do the right thing" and the crash reports will go into Xcode (Organizer, device logs) and symbolication will be done.

The script:

#!/bin/bash
# Copy crash reports so that they appear in device logs in Organizer in Xcode

if [ ! -e ~/Downloads/crash ]; then 
   echo "Download a crash report and save it as $HOME/Downloads/crash before running this script."
   exit 1
fi

cd ~/Library/Logs/CrashReporter/MobileDevice/
mkdir -p actx # add crash report to xcode abbreviated
cd actx

datestr=`date "+%Y-%m-%d-%H%M%S"`

mv ~/Downloads/crash "actx-app_"$datestr"_actx.crash"

Things can be automated to where you can drag and drop in Xcode Organizer by doing two things if you do use QuincyKit/PLCR.

Firstly, you have to edit the remote script admin/actionapi.php ~line 202. It doesn't seem to get the timestamp right, so the file ends up with the name 'crash' which Xcode doesn't recognize (it wants something dot crash):

header('Content-Disposition: attachment; filename="crash'.$timestamp.'.crash"');

Secondly, in the iOS side in QuincyKit BWCrashReportTextFormatter.m ~line 176, change @"[TODO]" to @"TODO" to get around the bad characters.

Mackie answered 9/1, 2013 at 16:50 Comment(0)
C
0

atos is being deprecated so if you are running OSX 10.9 or later you may need to run

xcrun atos

Warning: /usr/bin/atos is moving and will be removed from a future OS X release. It is now available in the Xcode developer tools to be invoked via: xcrun atos

Crowell answered 25/11, 2013 at 23:45 Comment(1)
Seems Apple is allowing for the DWARF format to morph with each release of the tools (makes sense, especially with the advent of Swift) so they're moving it to the tool distro.Frederickfredericka
S
0

I like to use Textwrangler to pinpoint errors in an original app upload binary rejection. (The crash data will be found in your itunesConnect account.) Using Sachin's method above I copy the original.crash to TextWrangler, then copy the symbolicatecrash file I've created to another TextWrangler file. Comparing the two files pinpoints differences. The symbolicatecrash file will have differences which point out the file and line number of problems.

Slipway answered 9/6, 2016 at 23:28 Comment(0)
G
0

For those looking for a working solution in 2022

Steps to Symbolicating iPhone App Crash Reports

  • Convert apple provided crash log in .txt format to .crash
  • Xcode > Window > Devices and simulators
  • Must select a connected & running ios device. (not a simulator, or offline device)
  • Select All Logs section, drag & drop the .crash file

Note that, the other solutions having symbolicatecrash is deprecated and its usage shows:

⚠️ symbolicatecrash is deprecated; it will be removed in future releases of Xcode ⚠️

Grallatorial answered 11/9, 2022 at 13:26 Comment(0)
A
-2

We use Google Crashlytics to supervise crash logs, the feeling is very timely and convenient to use.

Document links: https://docs.fabric.io/apple/crashlytics/missing-dsyms.html#missing-dsyms

All about Missing dSYMs Fabric includes a tool to automatically upload your project’s dSYM. The tool is executed through the /run script, which is added to your Run Script Build Phase during the onboarding process. There can be certain situations however, when dSYM uploads fail because of unique project configurations or if you’re using Bitcode in your app. When an upload fails, Crashlytics isn’t able to symbolicate and display crashes, and a “Missing dSYM” alert will appear on your Fabric dashboard.

Missing dSYMs can be manually uploaded following the steps outlined below.

Note: As an alternative to the automated dSYM upload tool, Fabric provides a command-line tool (upload-symbols)) that can be manually configured to run as part of your project’s build process. See the upload-symbols section below for configuration instructions.

...

Antho answered 5/1, 2018 at 5:42 Comment(0)

© 2022 - 2024 — McMap. All rights reserved.