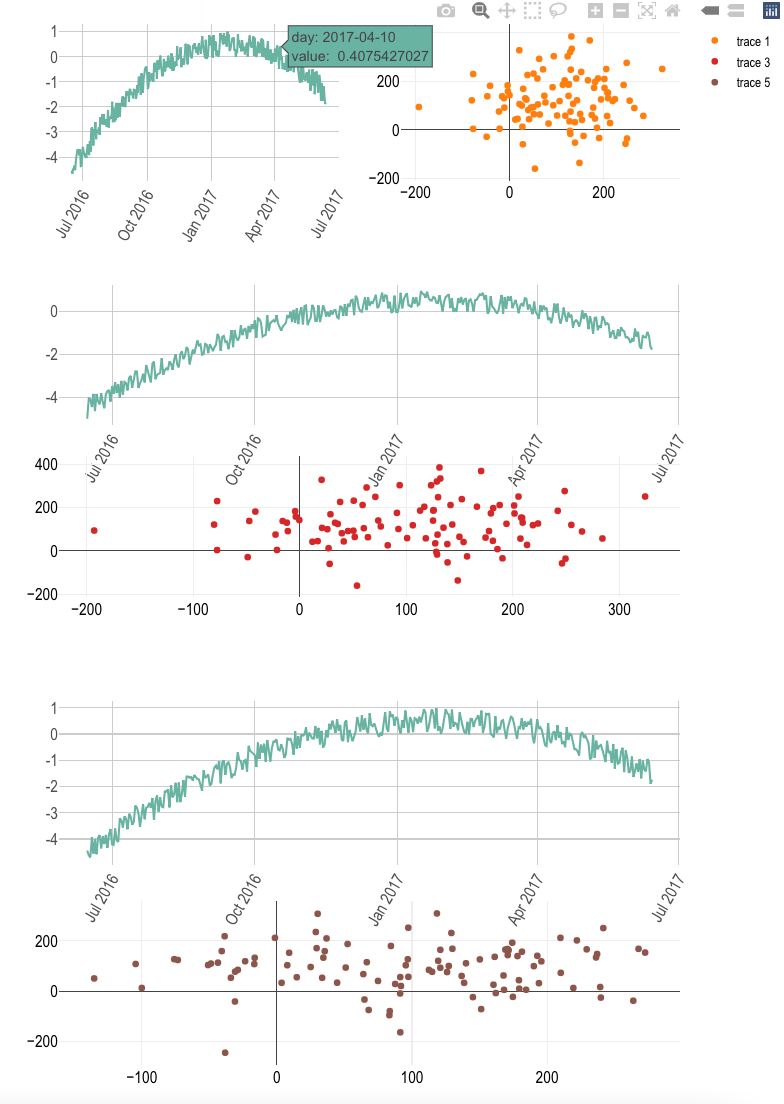
Using the "plotly" library in R - I generated some random data and made some interactive data visualizations:
library(plotly)
library(ggplot2)
library(dplyr)
library(hrbrthemes)

#subplot 1

data1 <- data.frame(
  day = as.Date("2017-06-14") - 0:364,
  value = runif(365) - seq(-140, 224)^2 / 10000
)

p1 <- ggplot(data1, aes(x=day, y=value)) +
  geom_line( color="#69b3a2") +
  xlab("") +
  theme_ipsum() +
  theme(axis.text.x=element_text(angle=60, hjust=1))

fig1 <- ggplotly(p1)

scatter_1 = data.frame(x = rnorm(100,100,100), y = rnorm(100,100,100))

fig2 <- plot_ly(data = scatter_1, x = ~x, y = ~y)


#subplot 2

data2 <- data.frame(
  day = as.Date("2017-06-14") - 0:364,
  value = runif(365) - seq(-140, 224)^2 / 10000
)

p2 <- ggplot(data2, aes(x=day, y=value)) +
  geom_line( color="#69b3a2") +
  xlab("") +
  theme_ipsum() +
  theme(axis.text.x=element_text(angle=60, hjust=1))

fig3 <- ggplotly(p2)

scatter_2 = data.frame(x = rnorm(100,100,100), y = rnorm(100,100,100))

fig4 <- plot_ly(data = scatter_1, x = ~x, y = ~y)

#subplot 3

data3 <- data.frame(
  day = as.Date("2017-06-14") - 0:364,
  value = runif(365) - seq(-140, 224)^2 / 10000
)

p3 <- ggplot(data3, aes(x=day, y=value)) +
  geom_line( color="#69b3a2") +
  xlab("") +
  theme_ipsum() +
  theme(axis.text.x=element_text(angle=60, hjust=1))

fig5 <- ggplotly(p3)

scatter_3 = data.frame(x = rnorm(100,100,100), y = rnorm(100,100,100))

fig6 <- plot_ly(data = scatter_3, x = ~x, y = ~y)
After this, I used the "subplot" function in the "plotly" library to make the three following subplots:
subplot1 <- subplot(fig1, fig2,  nrows = 1, margin = 0.05)
subplot2 <- subplot(fig3, fig4, nrows = 2, margin = 0.05)
subplot3 <- subplot(fig5, fig6, nrows = 2, margin = 0.05)
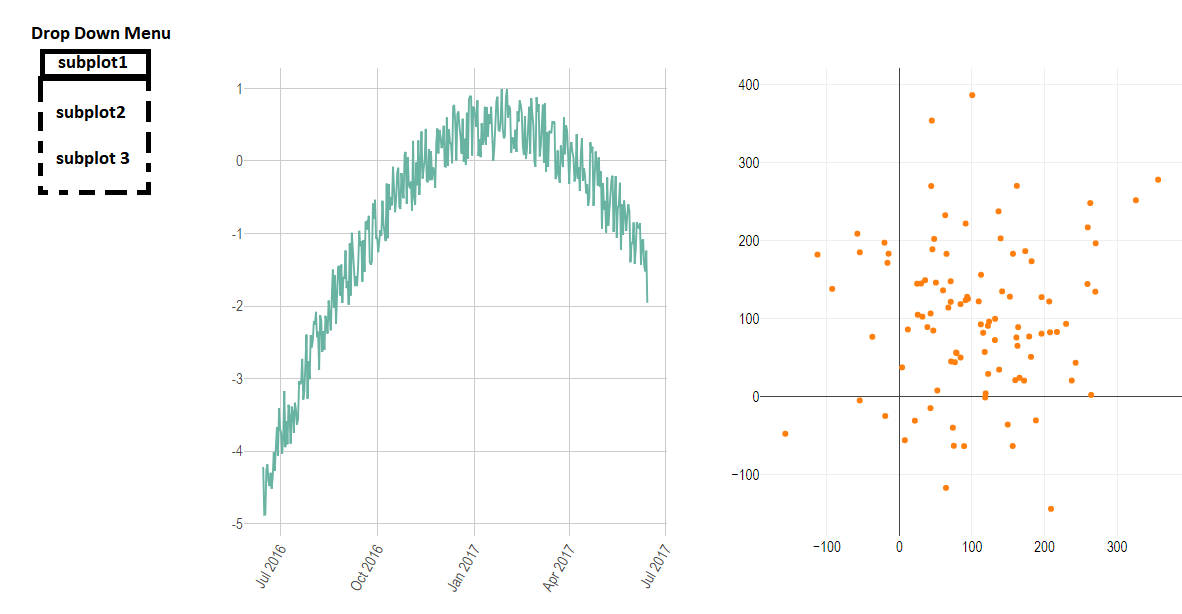
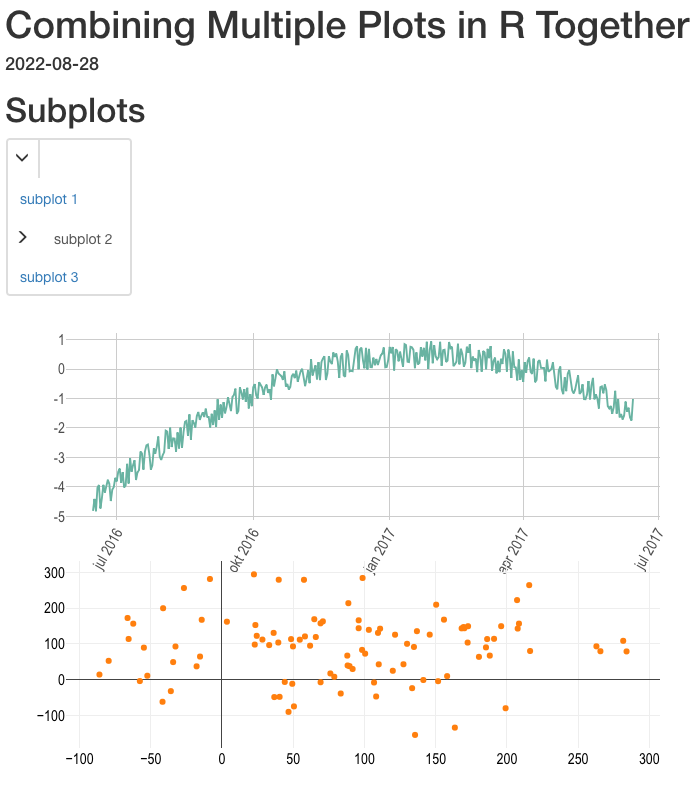
I was wondering if its possible to combine these three subplots into a single "object" (that can be later saved as an HTML file, e.g. using htmlwidgets) that would look something like this:
#pseudocode (e.g. imagine some "wrap" function)
results = wrap(subplot1, subplot2, subplot3)
 saveWidget(   results,   "results.html")
That is, combine the plots in such a way that the user can navigate between these 3 subplots. Is this possible?


manipulateWidget::combineWidgets. See here for an example. – Ekg