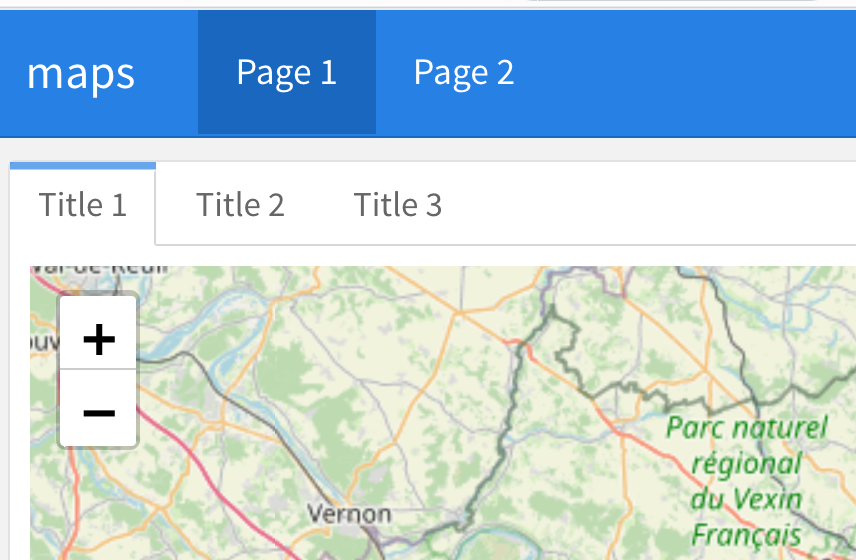
I have the following data:
library(leaflet)
library(leaflet.extras)
library(flexdashboard)
library(htmltools)
library(htmlwidgets)
library(plotly)
id = 1:1000
long = 2.2945 + rnorm( 1000, 0.1085246 , 0.1)
lat = 48.8584 + rnorm( 1000, 0.009036273 , 0.1)
my_data_1 = data.frame(id, lat, long)
id = 1:1000
long = 2.2945 + rnorm( 1000, 0.1085246 , 0.1)
lat = 48.8584 + rnorm( 1000, 0.009036273 , 0.1)
my_data_2 = data.frame(id, lat, long)
Using this data, I made these maps:
map1 = my_data_1 %>%
    leaflet() %>%
    addTiles() %>%
    addHeatmap(lng=~long,lat=~lat,max=100,radius=20,blur=10)

map2 = my_data_2 %>%
    leaflet() %>%
    addTiles() %>%
    addHeatmap(lng=~long,lat=~lat,max=100,radius=20,blur=10)

map3 = my_data_1 %>%
    leaflet() %>%
    addTiles() %>%
    addMarkers(clusterOption=markerClusterOptions())

map4 = my_data_2 %>%
  leaflet() %>%
  addTiles() %>%
  addMarkers(clusterOption=markerClusterOptions())
I found this R markdown template that I like over here (https://beta.rstudioconnect.com/jjallaire/htmlwidgets-showcase-storyboard/htmlwidgets-showcase-storyboard.html):
I am interested in seeing if the following task is possible:
- I would like to place "Map 1" in the first tab, create a dropdown menu for the second tab that allows the user to view "Map 2" and "Map 3", and create a third tab with "Map 4".
I am not sure how I to modify the Rmarkdown template to create this dropdown menu. I found some related posts online that discuss similar topics (e.g. How to add dropdown menu on tab / tabset [rmarkdown / bootstrap]), but I am not sure how to adapt the Rmarkdown template to add this option. I tried to modify the template and do this myself with the following code:
---
title: "maps"
output:
   flexdashboard::flex_dashboard:
        storyboard: true
        social: menu
        source: embed
---

```{r setup, include=FALSE}
#library(flexdashboard)
library(leaflet)
library(leaflet.extras)
id = 1:1000
long = 2.2945 + rnorm( 1000, 0.1085246 , 0.1)
lat = 48.8584 + rnorm( 1000, 0.009036273 , 0.1)
my_data_1 = data.frame(id, lat, long)
id = 1:1000
long = 2.2945 + rnorm( 1000, 0.1085246 , 0.1)
lat = 48.8584 + rnorm( 1000, 0.009036273 , 0.1)
my_data_2 = data.frame(id, lat, long)

```


Column {.tabset}
-------------------------------------

### Title 1

```{r}
map1 = my_data_1 %>%
    leaflet() %>%
    addTiles() %>%
    addHeatmap(lng=~long,lat=~lat,max=100,radius=20,blur=10)
map1
```

### Title 2  {.tabset .tabset-dropdown}

```{r}
map2 = my_data_2 %>%
    leaflet() %>%
    addTiles() %>%
    addHeatmap(lng=~long,lat=~lat,max=100,radius=20,blur=10)
map2

### map 3


map3 = my_data_1 %>%
  leaflet() %>%
  addTiles() %>%
  addMarkers(clusterOption=markerClusterOptions())
map3

```

### Title 3

```{r}
map4 = my_data_2 %>%
  leaflet() %>%
  addTiles() %>%
  addMarkers(clusterOption=markerClusterOptions())
map4
```
- This above code ran, but this code has not created the dropdown menu. Can someone please show me how I can fix this?
Thank you!


