Greek letter in Matlab plot
Asked Answered
S

2

8

I have created a plot in Matlab and now I would like to add a legend with the following command:

legend({'Pos1', 'Pos2', 'Pos3', '\alpha Pos4'}, 'Location', 'northeast', 'Interpreter', 'latex', 'fontsize', 22);
legend('boxoff')

The problem is that \alpha is not transformed into the greek letter. If I ommit the curly brackets {} then it works but I need them because I only want to label the first four lines.

How can I get the greek letter alpha?

Symposium answered 17/3, 2016 at 1:36 Comment(0)
P
5

I want to extend on Daniel's answer and explain some details.

What happens without {}

When legend entries are not specified in a cell array, only the properties Location and Orientation can be used in the direct call to legend. If other properties are present, they are interpreted as legend entries. That means Interpreter and TextSize and it's values would be legend entries. Adressing Adiel's comment on why it apparently works without {}: It not really does, it even throws a warning, indirectly because of the above mentioned reasons.

Sidenote: According to the syntax, the legend entries must be provided before the properities. Nevertheless it does work in any order but I do not recommend using this undocumented behaviour.

Selecting plots

You mention that you have to use the {} to select only the first four lines. This is not true because legend selects the first N plots by default. The problem was that the properties got interpreted as explained above. To select specific plots, you can use the plot handles to leave out the second plot:

legend([ph1,ph3,ph4,ph5], 'Pos1', 'Pos3', 'Pos4', 'Pos5');

Using other properties

To be able to directly use other properties in the call to legend, you can provide the legend entries as a cell array. This decouples the entries with the name-value-pairs of the properties. For example change the font size:

legend({'Pos1', 'Pos2', 'Pos3', 'Pos4'}, 'Fontsize', 22);

Another possibility is to use a handle for setting other properties without using a cell array:

l = legend('Pos1', 'Pos2', 'Pos3', 'Pos4');
set(l, 'Fontsize', 22);     % using the set-function
l.FontSize = 22;            % object oriented

latex-interpreter

If you set Interpreter to latex then all the contents of the legend entries need to be compilable by latex. That means \alpha cannot be used outside a math-environment. To add an inline-math expression in LaTeX you can enclose it with $-signs. So $\alpha$ works as mentioned in Daniel's answer. With the tex-interpreter, Matlab uses a subset of the TeX markup and automatically works for the supported special characters, so there would be no need for $...$ when you don't use the latex intrpreter.


Suggestions

  • Don't forget the $-signs.
  • Adress the specific plots in the call to legend.
  • Use a cell array and set all the properties in the call to legend directly.
  • With ... you can split the long line in several ones.

For example like this:

legend([ph1,ph3,ph4,ph5], ...
    {'Pos $\alpha$', 'Pos $\beta$', 'Pos $\gamma$', 'Pos  $\delta$'}, ...
    'Location', 'northeast', 'Interpreter', 'latex', 'FontSize', 22);

This is the complete code for the example:

figure; hold on;
ph1 = plot(0,-1,'*'); ph2 = plot(0,-2,'*');
ph3 = plot(0,-3,'*'); ph4 = plot(0,-4,'*');
ph5 = plot(0,-5,'*'); ph6 = plot(0,-6,'*');
legend([ph1,ph3,ph4,ph5], ...
    {'Pos $\alpha$', 'Pos $\beta$', 'Pos $\gamma$', 'Pos  $\delta$'}, ...
    'Location', 'northeast', 'Interpreter', 'latex', 'FontSize', 22);

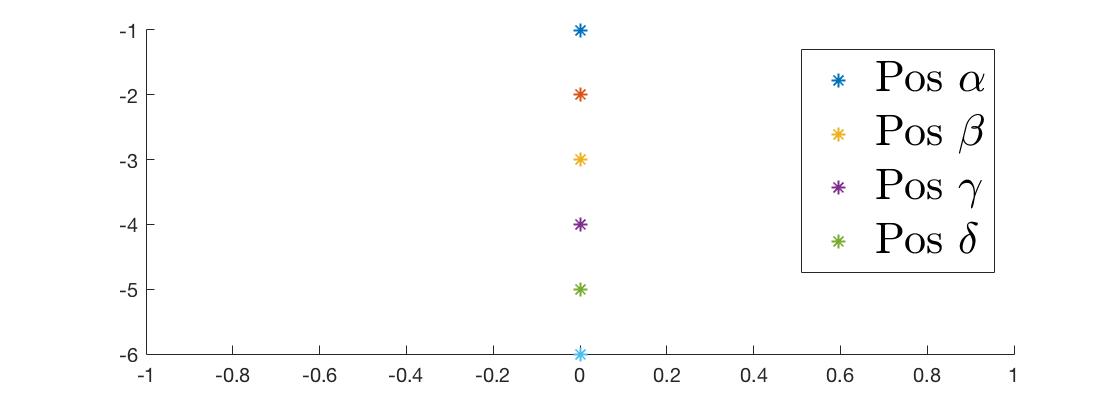
With this result:

example

Pokeberry answered 17/3, 2016 at 9:58 Comment(0)
M
6

You forgot the $

legend({'Pos1', 'Pos2', 'Pos3', '$\alpha$ Pos4'}, 'Location', 'northeast', 'Interpreter', 'latex', 'fontsize', 22);
Mignon answered 17/3, 2016 at 1:44 Comment(1)
When the $ is needed? Why without the {} it works?Metsky
P
5

I want to extend on Daniel's answer and explain some details.

What happens without {}

When legend entries are not specified in a cell array, only the properties Location and Orientation can be used in the direct call to legend. If other properties are present, they are interpreted as legend entries. That means Interpreter and TextSize and it's values would be legend entries. Adressing Adiel's comment on why it apparently works without {}: It not really does, it even throws a warning, indirectly because of the above mentioned reasons.

Sidenote: According to the syntax, the legend entries must be provided before the properities. Nevertheless it does work in any order but I do not recommend using this undocumented behaviour.

Selecting plots

You mention that you have to use the {} to select only the first four lines. This is not true because legend selects the first N plots by default. The problem was that the properties got interpreted as explained above. To select specific plots, you can use the plot handles to leave out the second plot:

legend([ph1,ph3,ph4,ph5], 'Pos1', 'Pos3', 'Pos4', 'Pos5');

Using other properties

To be able to directly use other properties in the call to legend, you can provide the legend entries as a cell array. This decouples the entries with the name-value-pairs of the properties. For example change the font size:

legend({'Pos1', 'Pos2', 'Pos3', 'Pos4'}, 'Fontsize', 22);

Another possibility is to use a handle for setting other properties without using a cell array:

l = legend('Pos1', 'Pos2', 'Pos3', 'Pos4');
set(l, 'Fontsize', 22);     % using the set-function
l.FontSize = 22;            % object oriented

latex-interpreter

If you set Interpreter to latex then all the contents of the legend entries need to be compilable by latex. That means \alpha cannot be used outside a math-environment. To add an inline-math expression in LaTeX you can enclose it with $-signs. So $\alpha$ works as mentioned in Daniel's answer. With the tex-interpreter, Matlab uses a subset of the TeX markup and automatically works for the supported special characters, so there would be no need for $...$ when you don't use the latex intrpreter.


Suggestions

  • Don't forget the $-signs.
  • Adress the specific plots in the call to legend.
  • Use a cell array and set all the properties in the call to legend directly.
  • With ... you can split the long line in several ones.

For example like this:

legend([ph1,ph3,ph4,ph5], ...
    {'Pos $\alpha$', 'Pos $\beta$', 'Pos $\gamma$', 'Pos  $\delta$'}, ...
    'Location', 'northeast', 'Interpreter', 'latex', 'FontSize', 22);

This is the complete code for the example:

figure; hold on;
ph1 = plot(0,-1,'*'); ph2 = plot(0,-2,'*');
ph3 = plot(0,-3,'*'); ph4 = plot(0,-4,'*');
ph5 = plot(0,-5,'*'); ph6 = plot(0,-6,'*');
legend([ph1,ph3,ph4,ph5], ...
    {'Pos $\alpha$', 'Pos $\beta$', 'Pos $\gamma$', 'Pos  $\delta$'}, ...
    'Location', 'northeast', 'Interpreter', 'latex', 'FontSize', 22);

With this result:

example

Pokeberry answered 17/3, 2016 at 9:58 Comment(0)

© 2022 - 2024 — McMap. All rights reserved.