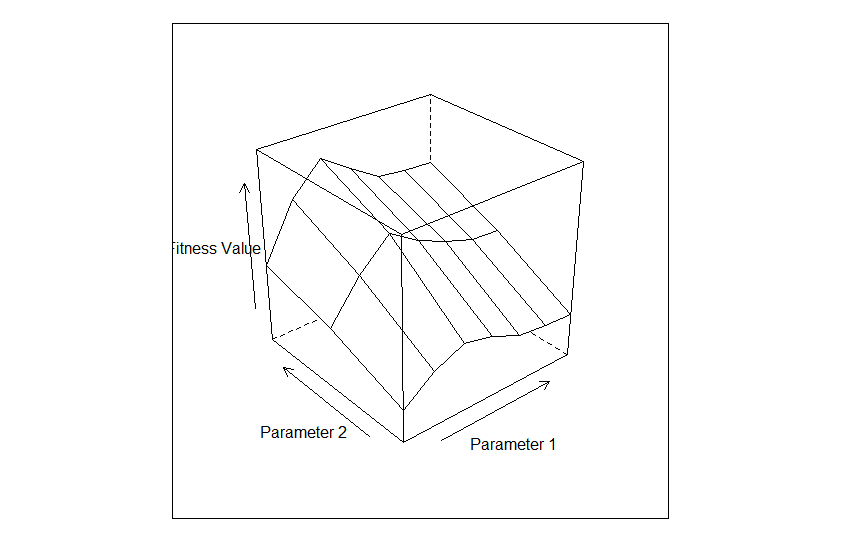
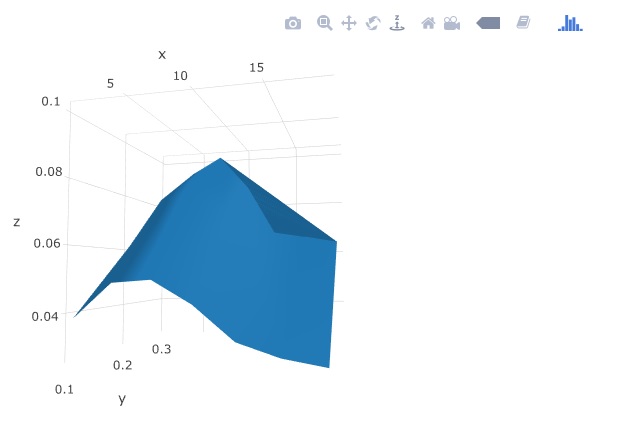
 I am trying to use 3D surface plots to analyze the stability of outcomes as a function of inputs. z is my outcome, and x and y are parameter values. Using lattice's wireframe I can make a surface plot no problem, but it would be nice to have the interactive and sharable capabilities of plotly. The volcano example doesn't show how to take x,y,z coordinates and make a surface plot. Anyone know how to concisely do that? Here is the lattice wireframe example and data:
library(lattice)

z <- c(0.035, 0.043, 0.036, 0.037, 0.016, 0.013, 0.025, 0.037, 0.039, 0.043,
0.049, 0.029, 0.025, 0.02,  0.032, 0.045, 0.049, 0.043, 0.027, 0.031,
0.028,0.039, 0.038, 0.037, 0.045, 0.046, 0.04,  0.041, 0.037, 0.048, 0.048,
0.032, 0.03,  0.032, 0.029, 0.043, 0.056, 0.057, 0.046, 0.034, 0.035,
0.026,0.036, 0.048, 0.038, 0.032, 0.034, 0.027, 0.024, 0.041, 0.05,  0.056,
0.038, 0.027, 0.034, 0.027, 0.042, 0.054, 0.054, 0.039, 0.036, 0.029,
0.027,0.04,  0.052, 0.058, 0.051, 0.028, 0.025, 0.035, 0.037, 0.053, 0.059,
0.049, 0.044, 0.035, 0.021, 0.044, 0.059, 0.054, 0.052, 0.041, 0.032,
0.036,0.039, 0.051, 0.056, 0.038, 0.04,  0.022, 0.015, 0.043, 0.054, 0.052,
0.05,  0.031, 0.03,  0.03,  0.031, 0.044, 0.051, 0.047, 0.04,  0.038,
0.037,0.06,  0.071, 0.07,  0.066, 0.038, 0.031, 0.045, 0.064, 0.065, 0.074,
0.08,  0.052, 0.048, 0.041, 0.053, 0.072, 0.079, 0.071, 0.043, 0.059, 0.05,
0.061, 0.061, 0.055, 0.069, 0.07,  0.057, 0.057, 0.055, 0.074, 0.071, 0.051,
0.048, 0.05,  0.053, 0.069, 0.086, 0.085, 0.07,  0.047, 0.05,  0.047,0.055,
0.073, 0.065, 0.056, 0.054, 0.048, 0.043, 0.063, 0.078, 0.087, 0.068, 0.047,
0.052, 0.048, 0.065, 0.085, 0.084, 0.062, 0.049, 0.05,  0.05, 0.068, 0.084,
0.095, 0.089, 0.052, 0.052, 0.062, 0.062, 0.086, 0.09,  0.078, 0.062, 0.058,
0.038, 0.068, 0.095, 0.09,  0.082, 0.069, 0.057, 0.058,0.064, 0.082, 0.087,
0.055, 0.053, 0.032, 0.033, 0.067, 0.087, 0.087, 0.079, 0.058, 0.053, 0.057,
0.047, 0.069, 0.085, 0.075, 0.068, 0.063, 0.062,0.076, 0.089, 0.095, 0.086,
0.056, 0.053, 0.063, 0.082, 0.08,  0.099, 0.101, 0.067, 0.065, 0.058, 0.066,
0.086, 0.103, 0.088, 0.051, 0.072, 0.06, 0.08,  0.078, 0.067, 0.084, 0.086,
0.067, 0.066, 0.068, 0.087, 0.087, 0.071, 0.063, 0.065, 0.067, 0.087, 0.104,
0.108, 0.086, 0.057, 0.063, 0.056,0.064, 0.087, 0.084, 0.07,  0.063, 0.061,
0.06,  0.076, 0.095, 0.11,  0.088, 0.057, 0.062, 0.067, 0.079, 0.097, 0.105,
0.079, 0.055, 0.064, 0.066,0.087, 0.104, 0.12,  0.113, 0.063, 0.07,  0.075,
0.073, 0.104, 0.111, 0.091, 0.072, 0.07,  0.05,  0.083, 0.114, 0.11,  0.098,
0.083, 0.077, 0.07, 0.078, 0.098, 0.105, 0.069, 0.062, 0.045, 0.046, 0.083,
0.106, 0.106, 0.093, 0.077, 0.075, 0.073, 0.057, 0.088, 0.105, 0.094, 0.084,
0.082, 0.081)

x <- c(1,  4,  7,  10, 13, 16, 19, 1,  4,  7,  10, 13, 16, 19, 1,  4,  7,
10, 13, 16, 19, 1,  4,  7,  10, 13, 16, 19, 1,  4,  7,  10,13, 16, 19, 1,
4,  7,  10, 13, 16, 19, 1,  4,  7,  10, 13, 16, 19, 1,  4,  7,  10, 13, 16,
19, 1,  4,  7,  10, 13, 16, 19, 1, 4,  7,  10, 13, 16, 19, 1,  4,  7,  10,
13, 16, 19, 1,  4,  7,  10, 13, 16, 19, 1,  4,  7,  10, 13, 16, 19, 1,  4,
7,  10, 13, 16, 19, 1,  4,  7,  10, 13, 16, 19, 1,  4,  7,  10, 13, 16, 19,
1,  4,  7,  10, 13, 16, 19, 1,  4,  7,  10, 13, 16, 19, 1,  4, 7,  10, 13,
16, 19, 1,  4,  7,  10, 13, 16, 19, 1,  4,  7,  10, 13, 16, 19, 1,  4,  7,
10, 13, 16, 19, 1,  4,  7,  10, 13, 16, 19, 1,  4,  7,  10, 13, 16, 19, 1,
4,  7,  10, 13, 16, 19, 1,  4,  7,  10, 13, 16, 19, 1,  4,  7,  10, 13, 16,
19, 1,  4,  7, 10, 13, 16, 19, 1,  4,  7,  10, 13, 16, 19, 1,  4,  7,  10,
13, 16, 19, 1,  4,  7,  10, 13, 16, 19, 1,  4,  7,  10, 13, 16, 19,1,  4,
7,  10, 13, 16, 19, 1,  4,  7,  10, 13, 16, 19, 1,  4,  7,  10, 13, 16, 19,
1,  4,  7,  10, 13, 16, 19, 1,  4,  7,  10,13, 16, 19, 1,  4,  7,  10, 13,
16, 19, 1,  4,  7,  10, 13, 16, 19, 1,  4,  7,  10, 13, 16, 19, 1,  4,  7,
10, 13, 16, 19, 1, 4,  7,  10, 13, 16, 19, 1,  4,  7,  10, 13, 16, 19, 1,
4,  7,  10, 13, 16, 19, 1,  4,  7,  10, 13, 16, 19)

y  <- c(0.1, 0.1, 0.1, 0.1, 0.1, 0.1, 0.1, 0.1, 0.1, 0.1, 0.1, 0.1, 0.1,
0.1, 0.1, 0.1, 0.1, 0.1, 0.1, 0.1, 0.1, 0.1, 0.1, 0.1, 0.1, 0.1, 0.1,
0.1,0.1, 0.1, 0.1, 0.1, 0.1, 0.1, 0.1, 0.1, 0.1, 0.1, 0.1, 0.1, 0.1, 0.1,
0.1, 0.1, 0.1, 0.1, 0.1, 0.1, 0.1, 0.1, 0.1, 0.1, 0.1, 0.1, 0.1, 0.1, 0.1,
0.1, 0.1, 0.1, 0.1, 0.1, 0.1, 0.1, 0.1, 0.1, 0.1, 0.1, 0.1, 0.1, 0.1, 0.1,
0.1, 0.1, 0.1, 0.1, 0.1, 0.1, 0.1, 0.1, 0.1, 0.1, 0.1, 0.1,  0.1, 0.1, 0.1,
0.1, 0.1, 0.1, 0.1, 0.1, 0.1, 0.1, 0.1, 0.1, 0.1, 0.1, 0.1, 0.1, 0.1, 0.1,
0.1, 0.1, 0.1, 0.2, 0.2, 0.2, 0.2, 0.2, 0.2, 0.2, 0.2, 0.2, 0.2, 0.2, 0.2,
0.2, 0.2, 0.2, 0.2, 0.2, 0.2, 0.2, 0.2, 0.2, 0.2, 0.2, 0.2, 0.2, 0.2, 0.2,
0.2, 0.2, 0.2, 0.2, 0.2, 0.2, 0.2, 0.2, 0.2, 0.2, 0.2, 0.2, 0.2, 0.2, 0.2,
0.2, 0.2, 0.2, 0.2, 0.2, 0.2, 0.2, 0.2, 0.2, 0.2, 0.2, 0.2, 0.2, 0.2, 0.2,
0.2, 0.2, 0.2, 0.2, 0.2, 0.2, 0.2, 0.2, 0.2, 0.2, 0.2, 0.2, 0.2, 0.2, 0.2,
0.2, 0.2, 0.2, 0.2, 0.2, 0.2, 0.2, 0.2, 0.2, 0.2, 0.2, 0.2, 0.2, 0.2, 0.2,
0.2, 0.2, 0.2, 0.2,0.2, 0.2, 0.2, 0.2, 0.2, 0.2, 0.2, 0.2, 0.2, 0.2, 0.2,
0.2, 0.2, 0.2, 0.3, 0.3, 0.3, 0.3, 0.3, 0.3, 0.3, 0.3, 0.3, 0.3, 0.3, 0.3,
0.3, 0.3, 0.3, 0.3, 0.3, 0.3, 0.3, 0.3, 0.3, 0.3, 0.3, 0.3, 0.3, 0.3, 0.3,
0.3, 0.3, 0.3, 0.3, 0.3, 0.3, 0.3, 0.3, 0.3, 0.3, 0.3, 0.3, 0.3, 0.3,
0.3,0.3, 0.3, 0.3, 0.3, 0.3, 0.3, 0.3, 0.3, 0.3, 0.3, 0.3, 0.3, 0.3, 0.3,
0.3, 0.3, 0.3, 0.3, 0.3, 0.3, 0.3, 0.3, 0.3, 0.3, 0.3, 0.3, 0.3, 0.3, 0.3,
0.3, 0.3, 0.3, 0.3, 0.3, 0.3, 0.3, 0.3, 0.3, 0.3, 0.3, 0.3, 0.3, 0.3, 0.3,
0.3, 0.3, 0.3, 0.3, 0.3, 0.3, 0.3, 0.3, 0.3, 0.3, 0.3, 0.3, 0.3, 0.3, 0.3,
0.3, 0.3, 0.3, 0.3)

wireframe(z ~ x * y, xlab="Parameter 1", ylab="Parameter 2", zlab="Fitness Value")
Using plotly I would like to do something similar, but it always says that z needs to be a matrix. And I don't understand how this maps to x and y.
library(plotly)
p <- plot_ly(x = x, y = y, z = z) %>% add_surface()
p
Even better would be a data.table example, because my data is actually in a data.table where z is a column, x and y are columns, and there are a large number of other parameter columns that will be used for plots.
df.ex <- data.table(Output=z,Input1=x,Input2=y,Input3=rnorm(315),Input4 =
abs(rnorm(315)+.5))

wireframe(df.ex$Output ~ df.ex$Input1 * df.ex$Input2)

