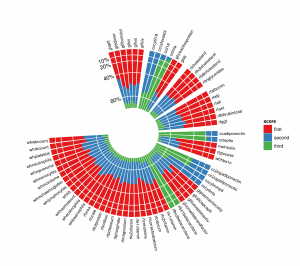
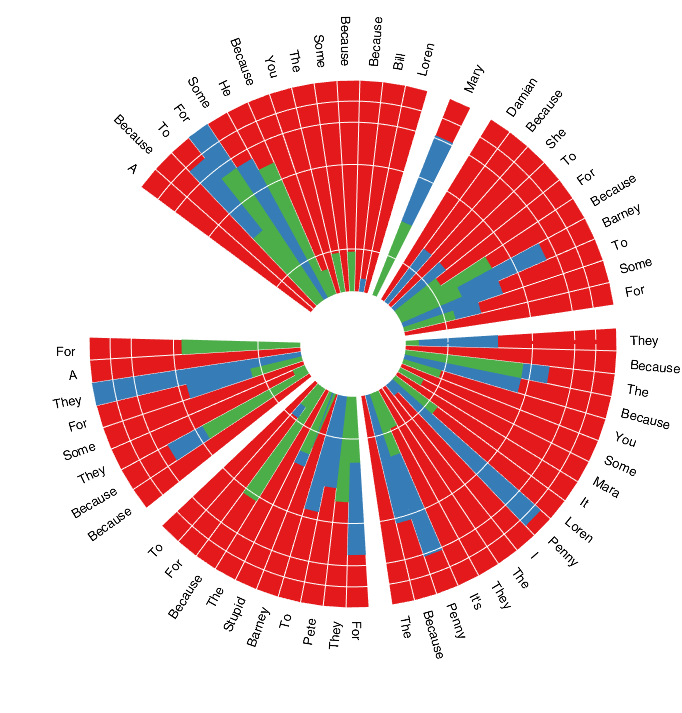
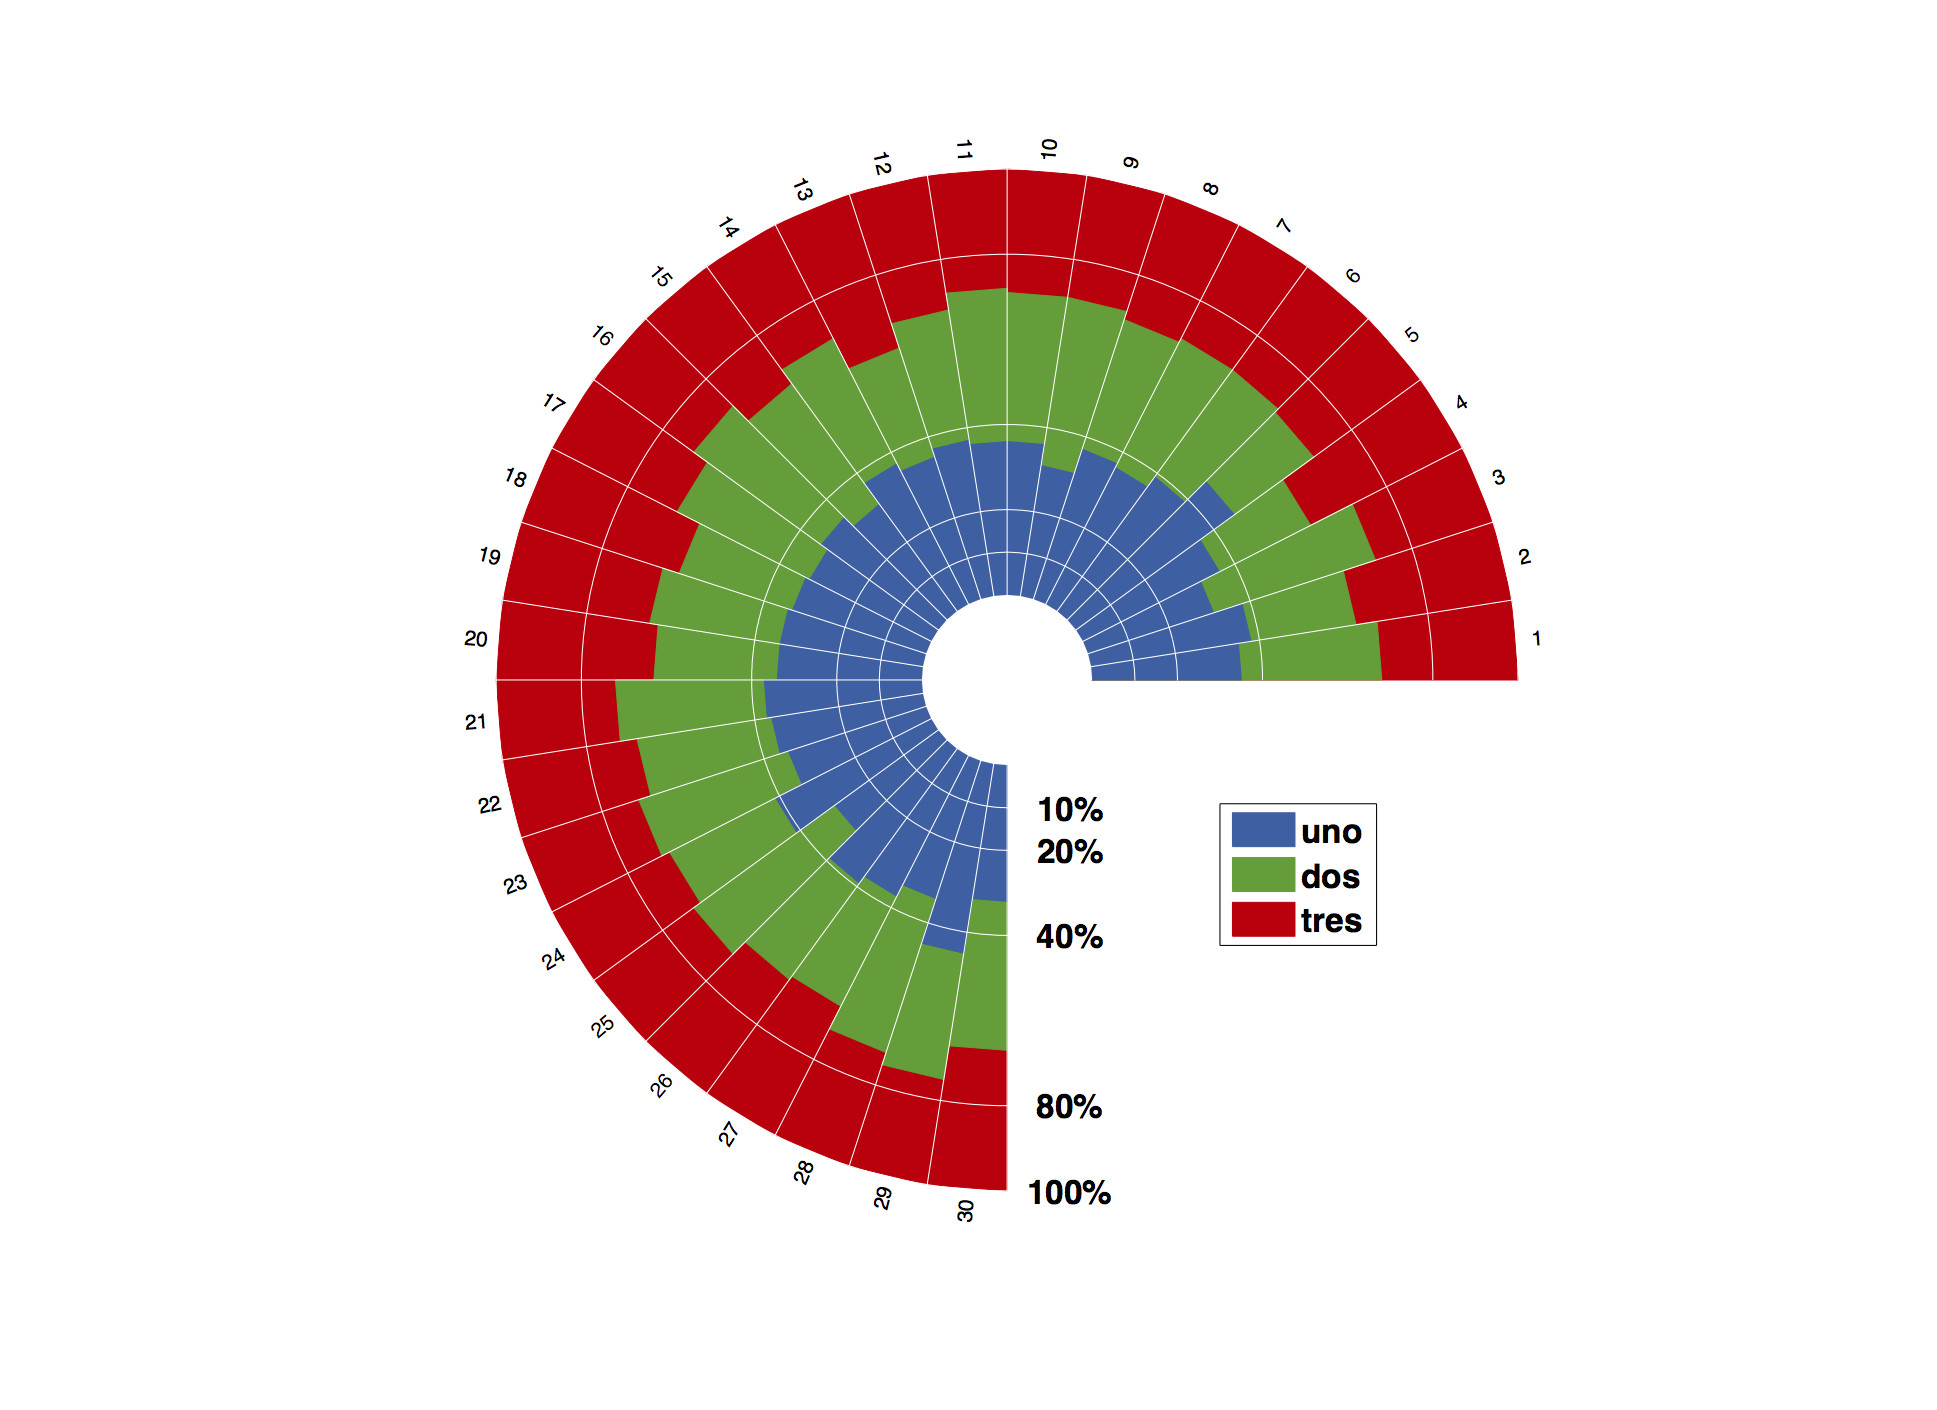
Polar histograms can be very useful for plotting stacked bar graph with multiple entries. An example is provided in the image below of the figure target. This can be made somehow easily in R with ggplot2. Similar function as 'rose' in matlab doesn't seem to allow such a result.
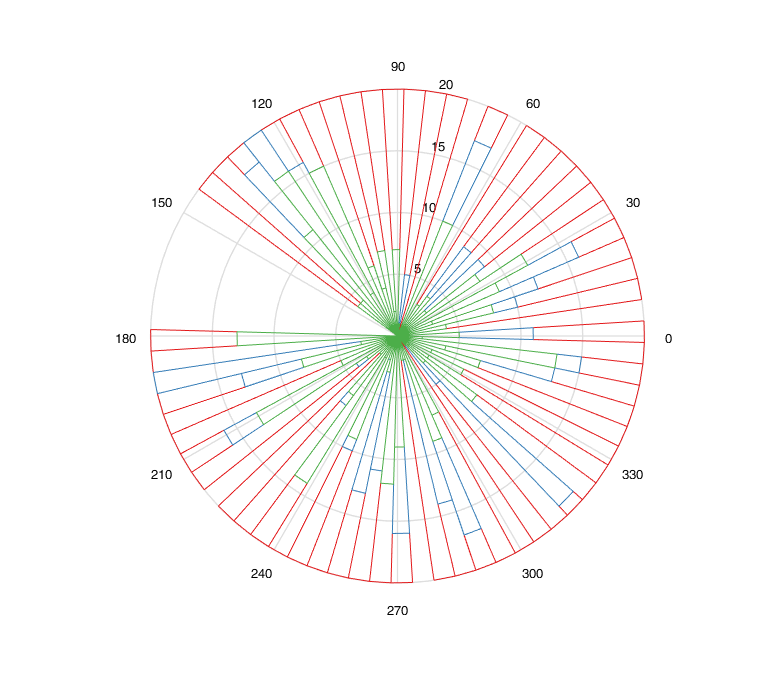
As a starting point, here is what I have:
- Script
% inputs
l = [1 1.4 2 5 1 5 10;
      10 5 1 5 2 1.4 1;
      5 6 3 1 3 2 4];
alpha = [10 20 50 30 25 60 50]; % in degrees
label = 1:length(alpha);

% setings
offset = 1;
alpha_gap = 2;

polarHist(l,alpha,label)
Function
polarHist
function polarHist(data,alpha,theta_label,offset,alpha_gap,ticks)

if nargin  360-alpha_gap*length(alpha)
    error('Covers more than 360°')
end

% code
theta_right = 90 - alpha_gap + cumsum(-alpha) - alpha_gap*[0:length(alpha)-1];
theta_left = theta_right + alpha;

col = get(gca,'colororder');

for j = 1:size(data,1)
    hold all
    if j == 1
        rho_in = kron(offset*ones(1,length(alpha)),[1 1]);
    else
        rho_in = rho_ext;
    end
    rho_ext = rho_in + kron(data(j,:),[1 1]);
    for k = 1:size(data,2)
        h = makewedge(rho_in(k),rho_ext(k),theta_left(k),theta_right(k),col(j,:));
        if j == size(data,1) && ~isempty(theta_label)
            theta = theta_right(k) + (theta_left(k) - theta_right(k))/2;
            rho = rho_ext(k)+1;
            [x,y] = pol2cart(theta/180*pi,rho);
            lab = text(x,y,num2str(theta_label(k),'%0.f'),'HorizontalAlignment','center','VerticalAlignment','bottom');
            set(lab, 'rotation', theta-90)
        end
    end
end
axis equal
theta = linspace(pi/2,min(theta_right)/180*pi);
%ticks = [0 5 10 15 20];
rho_ticks = offset + ticks;
ax = polar([ones(length(ticks(2:end)),1)*theta]',[rho_ticks(2:end)'*ones(1,length(theta))]');
set(ax,'color','w','linewidth',1.5)
axis off
for i=1:length(ticks)
    [x,y] = pol2cart((90)/180*pi,rho_ticks(i));
    text(x,y,num2str(ticks(i)),'HorizontalAlignment','right');
end
- Function
makewedge
function hOut = makewedge(rho1, rho2, theta1, theta2, color)
%MAKEWEDGE Plot a wedge.
% MAKEWEDGE(rho1, rho2, theta1, theta2, color) plots a polar
% wedge bounded by the given inputs. The angles are in degrees.
%
% h = MAKEWEDGE(...) returns the patch handle.

ang = linspace(theta1/180*pi, theta2/180*pi);
[arc1.x, arc1.y] = pol2cart(ang, rho1);
[arc2.x, arc2.y] = pol2cart(ang, rho2);
x = [arc1.x arc2.x(end:-1:1)];
y = [arc1.y arc2.y(end:-1:1)];
newplot;
h = patch(x, y, color);
if ~ishold
    axis equal tight;
end
if nargout > 0
     hOut = h;
end
The result is still far from the output of ggplot2 but I think this is a start. I'm struggling to add legend (rows of l)...

roseplots? – Attorney