How to annotate grouped bar plot with percent by hue/legend group
Asked Answered
N

1

1

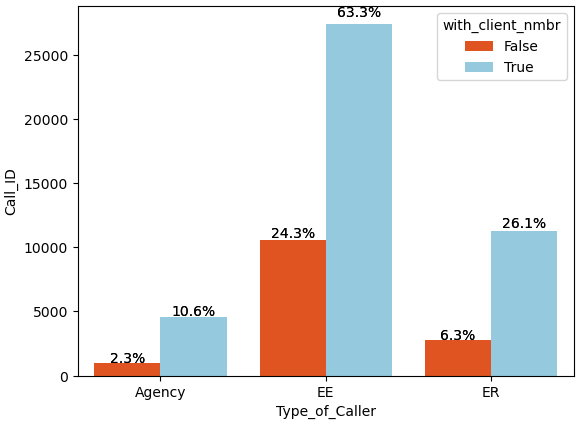
I want to add percentage on the top of bars according to the hue. That means all the red and blue bars are equal to 100% respectively.

I can make the blue bars equal to 100%, but the red bars can't. Which parts should be modified?

Imports and Sample Data

import pandas as pd
import numpy as np
import matplotlib.pyplot as plt
import seaborn as sns

# sample data
np.random.seed(365)
rows = 100000
data = {'Call_ID': np.random.normal(10000, 8000, size=rows).astype(int),
        'with_client_nmbr': np.random.choice([False, True], size=rows, p=[.17, .83]),
        'Type_of_Caller': np.random.choice(['Agency', 'EE', 'ER'], size=rows, p=[.06, .77, .17])}
all_call = pd.DataFrame(data)

   Call_ID  with_client_nmbr Type_of_Caller
0    11343              True             EE
1    14188              True         Agency
2    16539             False             EE
3    23630              True             ER
4    -7175              True             EE

Aggregate and Plot

df_agg= all_call.groupby(['Type_of_Caller','with_client_nmbr'])['Call_ID'].nunique().reset_index()

ax = sns.barplot(x='Type_of_Caller', y='Call_ID', hue='with_client_nmbr',
                 data=df_agg,palette=['orangered', 'skyblue'])

hue_order = all_call['with_client_nmbr'].unique()
df_f = sum(all_call.query("with_client_nmbr==False").groupby('Type_of_Caller')['Call_ID'].nunique())
df_t = sum(all_call.query("with_client_nmbr==True").groupby('Type_of_Caller')['Call_ID'].nunique())

for bars in ax.containers:
    if bars.get_label() == hue_order[0]:
        group_total = df_f
    else:
        group_total = df_t
    for p in ax.patches:
        width = p.get_width()
        height = p.get_height()
        x, y = p.get_xy()
        ax.annotate(f'{(height/group_total):.1%}', (x + width/2, y + height*1.02), ha='center')
plt.show()

enter image description here

  • print(hue_order) is ['False', 'True']
Nagpur answered 19/8, 2021 at 14:59 Comment(0)
P
2
  • It's typically not required to use seaborn to plot grouped bars, it's just a matter of shaping the dataframe, usually with .pivot or .pivot_table. See How to create a grouped bar plot for more examples.
    • Using pandas.DataFrame.plot with a wide dataframe will be easier, in this case, than using a long dataframe with seaborn.barplot, because the column / bar order and totals coincide.
    • This reduces the code from 16 to 8 lines.
  • See this answer for adding annotations as a percent of the entire population.
  • Tested in python 3.8.11, pandas 1.3.1, and matplotlib 3.4.2

Imports and DataFrame Transformation

import pandas as pd
import matplotlib.pyplot as plt

# transform the sample data from the OP with pivot_table
dfp = all_call.pivot_table(index='Type_of_Caller', columns='with_client_nmbr', values='Call_ID', aggfunc='nunique')

# display(dfp)
with_client_nmbr  False   True
Type_of_Caller                
Agency              994   4593
EE                10554  27455
ER                 2748  11296

Use matplotlib.pyplot.bar_label

  • Requires matplotlib >= 3.4.2
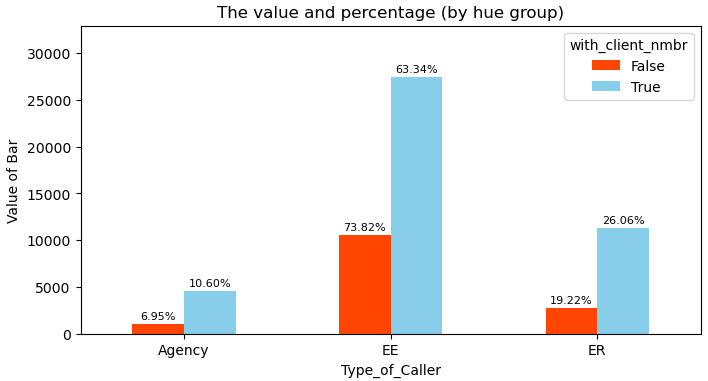
  • Each column is plotted in order, and the pandas.Series created by df.sum() has the same order as the dataframe columns. Therefore, zip totals to the plot containers and use the value, tot, in labels to calculate the percentage by hue group.
  • Add custom annotations based on percent by hue group, by using the labels parameter.
    • (v.get_height()/tot)*100 in the list comprehension, calculates percentage.
  • See this answer for other options using .bar_label
# get the total value for the column
totals = dfp.sum()

# plot
p1 = dfp.plot(kind='bar', figsize=(8, 4), rot=0, color=['orangered', 'skyblue'], ylabel='Value of Bar', title="The value and percentage (by hue group)")

# add annotations
for tot, p in zip(totals, p1.containers):
    
    labels = [f'{(v.get_height()/tot)*100:0.2f}%' for v in p]
    
    p1.bar_label(p, labels=labels, label_type='edge', fontsize=8, rotation=0, padding=2)

p1.margins(y=0.2)
plt.show()

enter image description here

Pinelli answered 19/8, 2021 at 16:38 Comment(0)

© 2022 - 2024 — McMap. All rights reserved.