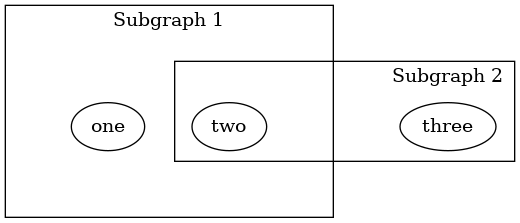
I was wondering if it's possible to do something like this in Graphviz:
As you can see, node "two" is inside two clusters while the clusters aren't recursive.
Note: Image made with Dia.
No, this is currently not possible, this other answer describes briefly why.
While Graphviz won't produce overlapping clusters directly, it will allow you to create overlapping clusters with a bit of editing. (For more info see: https://www.graphviz.org/faq/#FaqDotWithCoords)
Start with:
digraph o {
  graph [newrank=true nodesep=.5]

  subgraph cluster1 {
    graph [margin=50 label="Subgraph 1"]
    {rank=same
      one-> two [style=invis]
    }
  }
  subgraph cluster2 {
    graph [label="Subgraph 2"]
    three
  }

  {rank=same
    one two three
  }
}
run this command: dot -Tdot myfile.gv >myfile.dot
Then edit myfile.dot to change the boundary box of cluster2. Like so:
digraph o {
    graph [bb="0,0,398,175",
        newrank=true,
        nodesep=.5
    ];
    node [label="\N"];
    {
        graph [rank=same];
        one [height=0.5,
            pos="85,76",
            width=0.75827];
        two [height=0.5,
            pos="176,76",
            width=0.77632];
        three   [height=0.5,
            pos="340,76",
            width=0.99297];
    }
    subgraph cluster1 {
        graph [bb="8,8,254,167",
            label="Subgraph 1",
            lheight=0.21,
            lp="131,155.5",
            lwidth=1.17,
            margin=50
        ];
        {
            graph [rank=same];
            one;
            two;
            one -> two  [pos="e,147.67,76 112.37,76 120.74,76 129.1,76 137.46,76",
                style=invis];
        }
    }
    subgraph cluster2 {
        graph [bb="135,50,390,125",  // X1 edited
            label="Subgraph 2",
            lheight=0.21,
            lp="340,113.5",
            lwidth=1.17
        ];
        three;
    }
}
run this command on the edited file: neato -n2 -Tpng myfile.dot >myfile.png
Giving:

© 2022 - 2024 — McMap. All rights reserved.