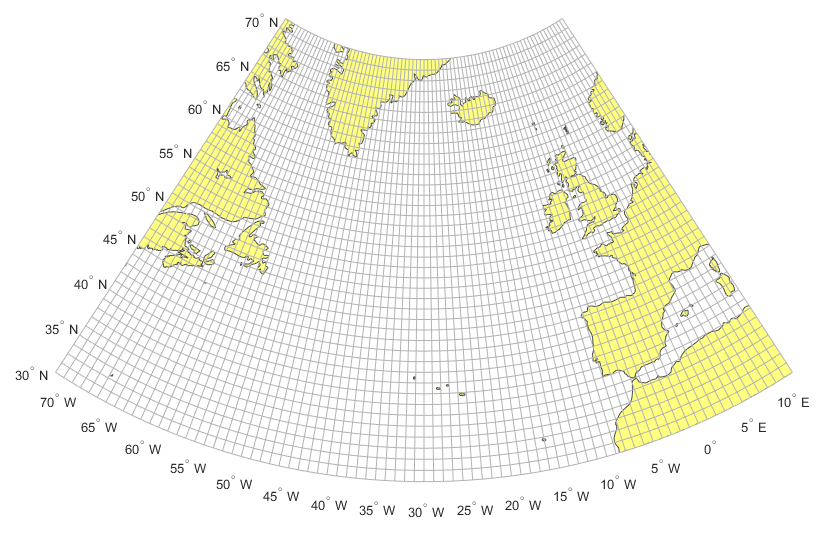
I have created the following map, which has a uniform gray grid with 1° intervals both for meridians and parallels:
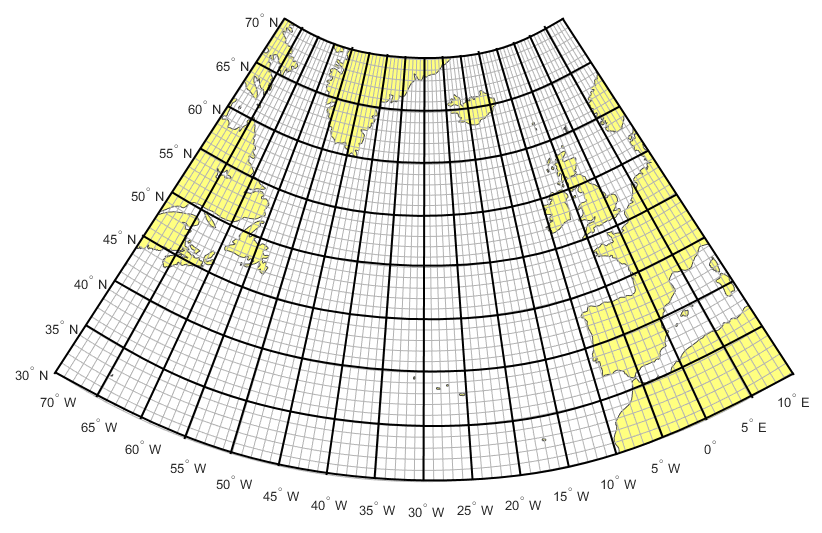
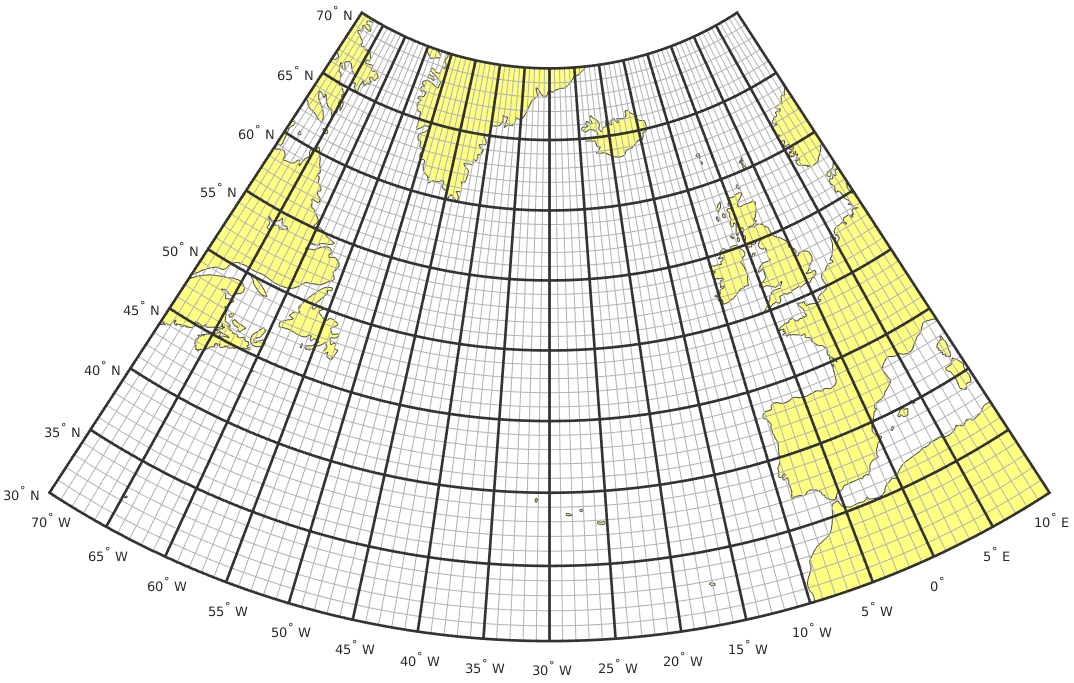
I would also like to have the meridians and parallels thicker and in black for every 5° interval (while keeping the 1° grid), so that gridlines match the latitude and longitude labels as shown below:
I know that MATLAB has major and minor grids for standard 2D plots, and I have used them in the past. However, as far as I know, maps don't have this feature.
I think that what I want to do can be achieved by accessing the map object properties (using gcm or getm) and specifying a black color property to the specific subset of meridians and parallels (using setm). Maybe the functions gridm or axesm can handle this, but I'm not sure.
In practice, I don't know how to do this as I haven't got any experience with maps. I would really appreciate a helping hand.
Code:
Note: This code requires the Mapping Toolbox.
% Read vector features and attributes from shapefile.
landareas = shaperead('landareas.shp', 'UseGeoCoords', true);

% Define map axes and set map properties.
axesm ('lambert',...
    'MapLonLimit', [-70 10],...
    'MapLatLimit', [30 70],...
    'MapParallels', [38.00555556 71.01111111],...
    'Frame', 'on',...
    'FLineWidth', 1,...
    'Grid', 'on',...
    'GLineStyle', '-',...
    'GLineWidth', 0.1,...
    'GColor', [.7 .7 .7]);

% Display map latitude and longitude data.
geoshow(landareas, 'FaceColor', [1 1 .5], 'EdgeColor', [.3 .3 .3]);

% Toggle and control display of graticule lines.
gridm('MLineLocation', 1,...
    'MLabelLocation', 5,...
    'PLineLocation', 1,...
    'PLabelLocation', 5);

% Toggle and control display of meridian labels.
mlabel on;

% Toggle and control display of parallel labels.
plabel on;

axis off;


