Display aggregate value next to label in frame in treemap
Asked Answered
D

1

0

Following my question here, I am now building nice treemaps.

I would like to show the aggregate value of the branch next to its label (Equities and ETFs). I have looked at px.treemap and fig.update_layout parameters but I can't find what I am looking for. Is it possible ?

fig = px.treemap(shares_data,
                 title=tit,
                 path=['Type', 'Stock'],
                 values='Holding',
                 color='Growth',
                 color_continuous_scale=[(0, "red"), (scale_mid, "yellow"), (1, "green")],
                  )

fig.update_layout(width=1600, height=950,
                  paper_bgcolor='black',
                  plot_bgcolor='black'
                  )

fig.update_traces(root_color="black")

fig.update_layout(title_font_color="white")

fig.update_layout(coloraxis_colorbar=dict(tickfont={"color":'white'},titlefont={"color":'white'}),)

fig.data[0].customdata = fig.data[0].marker.colors

fig.data[0].texttemplate = "<b>%{label}</b><br>Holding: R%{value:.2f}<br>Growth: <b>%{customdata:.1f}</b>%<br>"

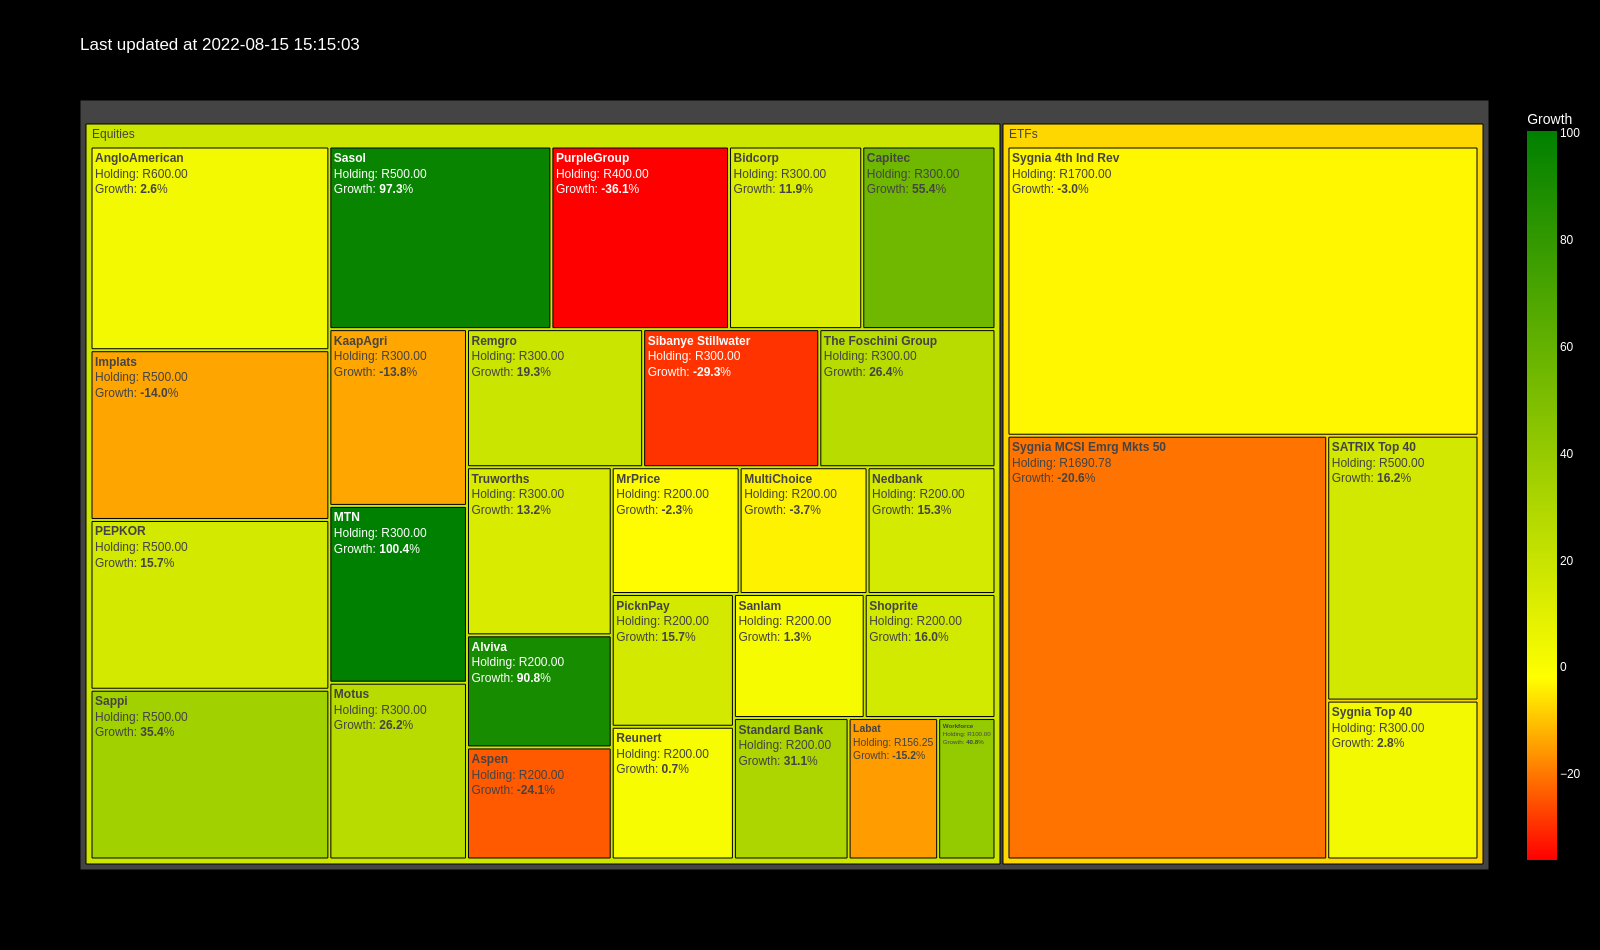
treemap

Dannielledannon answered 15/8, 2022 at 15:27 Comment(0)
D
0

Using Brendan's comment to this answer, I was able to pre-calculate the proportional values i.e. holding * growth for each holding, and then get the average for each section.

The part of writing to the csv changed to:

etfavg = etftot/etfcount
equitiesavg = equitiestot/equitiescount
etfval = '<b>ETFs: ' + str(round(etftot, 1)) + '%</b>'
equitiesval = '<b>Equities: ' + str(round(equitiestot, 1)) + '%</b>'

# write data to csv
for i in fullset:
    if i in etfs:
        line = [etfval, i, fullset[i][0], fullset[i][1]]
    else:
        line = [equitiesval, i, fullset[i][0], fullset[i][1]]
    writer.writerow(line)
Dannielledannon answered 28/3, 2023 at 10:0 Comment(1)
Funny, the values are in the hover data, but there doesn't seem to be a property to display it :-/Dannielledannon

© 2022 - 2024 — McMap. All rights reserved.