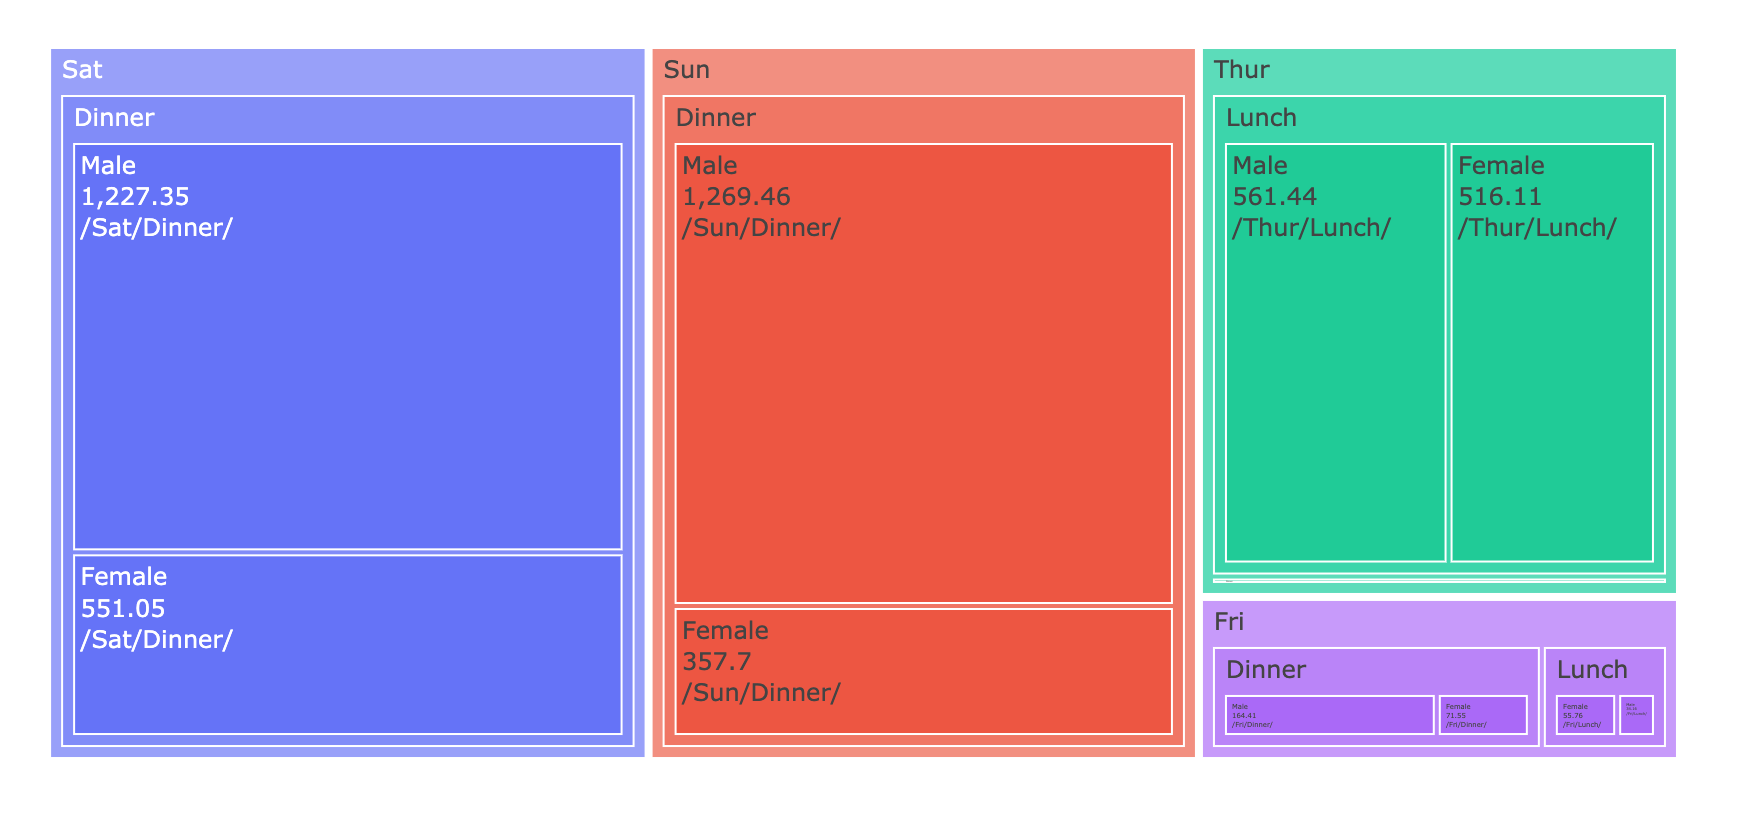
Currently, plotly express treemap shows only label inside treemap. How to include the value alongside the label?
How to update plotly express treemap to have both label as well as the value inside the plot?
Asked Answered
That's why I don't like express, there are too many limitations and to make these kinds of changes you have to access the trace either way. From my point of view it is better and more code-transparent to use plain plotly instead.
That being said, you can access the textinfo attribute of the trace to do this. From the reference:
Determines which trace information appear on the graph.
Any combination of
"label","text","value","current path","percent root","percent entry","percent parent"joined with a"+"OR"none".
Taking an example from the site:
df = px.data.tips()
fig = px.treemap(df, path=['day', 'time', 'sex'], values='total_bill')

# this is what I don't like, accessing traces like this
fig.data[0].textinfo = 'label+text+value+current path'

fig.layout.hovermode = False
fig.show()
Also take a look at the texttemplate attribute for formatting options.
Even though you don't like it, still a nice answer, thanks. Is it also possible to show the aggregated values or percentages in the outer boxes? In your example the outer box should have: SAT 1,778.4 and the inner box could have Dinner 1,778.4 –
Jape
@Jape it is possible with a workaround. You could preformat your data to add it to the actual label text and make sure you're using an id column instead of relying on label only. Then it would read something like Sat (3,034.34) > Dinner (2,234.23) > Male (1,227.35), etc –
Heterotaxis
Can you comment on why this affects only the label for the leaf node, but none of the parent nodes? –
Melville
@Heterotaxis thank you for the idea. I have an unanswered question about it here and have been looking for a solution. –
Moonlight
@Heterotaxis Funny, the values are in the hover data, but there doesn't seem to be a property to display it :-/ –
Moonlight
px is great. keeping the api for treemap is minimal is understandable because the path makes things complex, but percentages belong in a high-level api –
Inkle
fig.update_traces(textinfo="label+value+percent parent", selector=dict(type="treemap")) –
Dissymmetry © 2022 - 2024 — McMap. All rights reserved.

