Debugging with Android Studio stuck at "Waiting For Debugger" forever
Asked Answered
R

43

245

UPDATE The supposed duplicate is a question on being stucking in "Waiting For Debugger" when executing Run, while this question is on being stucking in "Waiting For Debugger" when executing Debug, the steps to produce the problem is different, and the solution(s) are different as well.


Whenever I try to use Android Studio's Debug function, the Run status would always stuck at:

Launching application: com.astrotek.parashoot.debug/com.astrotek.ptpviewer.StarterActivity.
DEVICE SHELL COMMAND: am start -n "com.astrotek.parashoot.debug/com.astrotek.ptpviewer.StarterActivity" -a android.intent.action.MAIN -c android.intent.category.LAUNCHER
Starting: Intent { act=android.intent.action.MAIN cat=[android.intent.category.LAUNCHER] cmp=com.astrotek.parashoot.debug/com.astrotek.ptpviewer.StarterActivity }

While the device (Samsung Galaxy S3 Android 4.3) I'm debugging would display

enter image description here

This has being the case from Android Studio 0.8.8 all the way to 1.0. And on the same computer I can perform debugging using Eclipse on the same device without any issues.

So the question is what can I do to make Android Studio debugging work?


Update: The same thing happens when debugging on Nexus 7 (2013) running Android 5.0; and testing on another machine rendered the same result. I can't be the only one encountering this issue :-/


Update: Opened a bounty since this issue is so annoying. Even re-installing the app doesn't solve. Nexus 5 running Cyano, Win7 64. The ADB log is telling:

8568-8568/it.myapp:myprocess W/ActivityThread﹕ Application it.myapp is waiting for the debugger on port 8100...
8568-8568/it.myapp:myprocess I/System.out﹕ Sending WAIT chunk

Also, I can't find an easy way to disconnect nor reset ADB connection in Android Studio.

Ruthi answered 12/12, 2014 at 2:48 Comment(10)
If you haven't already, you could try unchecking "Use Host GPU" in the AVD Config for your emulator.Apoplectic
@JosephWebber Thanks for the suggestion, but I'm debugging on an actual hardware thoughRuthi
are you using a custom mod or stock one?Kandace
I tested on Nexus 7 2013 with stock Android 4.4.2, and Samsung S3 with Android 4.3, neither worked.Ruthi
Hi, I got similar issue, I have try solution here but not work. Please help answer my question: https://mcmap.net/q/119004/-waiting-for-debugger-message-stuck-when-debug-app/5241603Simferopol
Possible duplicate of Why Android Studio says "Waiting For Debugger" if am NOT debugging?Pagination
@Ruthi I took a look again at both questions, they still look the same to me, yours has more logs/images. The solution I mention in what I believe is a duplicate, has helped multiple people with the issue you have described on AOSP Issue tracker. Can you explain how yours is a different issue? This is my first time marking something as a duplicate, I probably should have marked the other question as a duplicate instead.Wyatan
@Ruthi Removing the duplicate flag and will link my answer here since the same question you asked might be solved using a quicker method for some people.Wyatan
in my case i have to uncheck Wait for debugger in device Settings.Darill
Nothing helped me of all the solutions. This problem is already years old. Its a shame that the developers of Androidstudio doesn't care about this. So many hours lost with hacking around to get into the debug mode.Ivanivana
R
12

Both of my dev machines have JDK 8 installed, the debugging function is restored once JDK 7.0.71 was installed and JAVA_HOME environmental variable was set to point to the new JDK.

Guess there's some compatibility issue between Android Studio + ADB + JDK8 (Eclipse + ADB + JDK8 works fine).

Ruthi answered 14/12, 2014 at 7:2 Comment(7)
I have the same problem, very annoying since requires phone reboot. Using JDK 1.7.0b147Kandace
JDK 8 is not officially supported by Android Studio - I have had problems compiling projects and they were resolved by going back to JDK 7.Gluck
where to change the version of JDK8 to JDK7 in latest version of Android StudioHalves
@AnandKrish you have to change the default JDK/JRE of the computing environment, basically when you execute javac -version, the result should be javac 1.7.xxx. On the other hand, I'm using JDK 8 (1.8.0_60) on OSX and the aforementioned issue doesn't seem to exist anymore.Ruthi
Correct! My machine have JDK 7 and JDK 8 installed. I have resolved this issue by change JDK location (Android Studio 2.1.1: File - Project Structure - SDK Location - JDK location) from JDK 8 to JDK 7.Harbaugh
Just a note - the current version of Android Studio, 2.2.3, indicates that JDK 8 is required, so this is no longer the correct answer for those on the latest version.Labionasal
I switched back to the embedded version (recommended) thru Project structure as suggested above - and that fixed the issue hanging on "collecting data". ThanksPym
B
277

Obviously is yet another Android Studio, or rather ADB bug.

Just use this command to disable it. adb shell am clear-debug-app

OR

Ensure there is nothing to wait for, by automatic uninstall from Device before each test-run, using Gradle's uninstallAll task, as mentioned in:
stackoverflow.com/Auto uninstall before install?

Burack answered 11/6, 2019 at 10:31 Comment(4)
where this command should be used? in the terminal?Cracy
@AndreaBuzzelli Yes, in your terminalBurack
Thanks man. Just ran this in Terminal in AS and it cleared it up for me.Patrilocal
"adb shell am clear-debug-app" worked fine for me for virtual machine.Coenobite
M
113

On some machines/projects the debugger do not attach automatically so you need to attach it manually (studio menu -> Run -> Attach debugger to Android process)

Merthiolate answered 14/9, 2016 at 8:57 Comment(4)
Mine seemed to connect to the app before it was completely launched and "waiting for debugger", telling it to connect a second time after it was already connected resolved that. (android studio 162)Fructose
I was just in the Release mode :DVerbalism
This work, when I try to run instrumented test in a virtual android, I get test to run. But it does not solve problem, that i have set test ti be to run. It is debugged!Coenobite
so how to make it attach automatically??Mcginley
L
111

Restarting Testing device fix the issue for me.

Lenardlenci answered 29/2, 2016 at 13:0 Comment(5)
Same here, I tried everything above and this one did it for me.. SighCittern
Same here. My device was showing the message even when not connected to dev machine (not connected over adb in any way). So all the advice regarding Android Studio and ADB were irrelevant. TurningUSB debugging off/on didn't help either Rebooting the device was the only way to fix it.Ragen
Me device (emulated) was showing that message any time I opened the app (through Android Studio, or just from the launcher). Tried a whole bunch of stuff. Full on rebooting the phone didn't occur to me because it's been closed several times (but with a saved state, duh). This did the trick!Alisiaalison
yes, holy restart helped for me too.Yamauchi
While this work. It is not a good solution. This problem keeps coming up every now and then.Televisor
S
64

Restarting Android Studio fix the issue for me.

Sinecure answered 25/9, 2015 at 4:57 Comment(4)
Funny thing is that is the usual fix for Xcode problems. Apparently both platforms are not that different at the end :)Sinecure
No. Not for me.Bostick
Sorry to hear that. Apparently 2 years later, there is another problem & (hopefully) solution :)Sinecure
worked on AS 2023Complicity
P
35

After clicking on the run icon. If it is stuck waiting for a debugger means it is not attached to the app. You have to manually attach by clicking on Attach Debugger to Android process. It is on the right side of the run icon. I had focus this icon in linked image.

Updated Image for Attach Debugger to Android process Icon

new Image for Attach Debugger icon

Prothalamion answered 7/10, 2018 at 18:19 Comment(8)
what if i am not launching debug, bug just running the appAlarise
Exactly lxknvlk, here it is 2021 using android studio 4.2.2 and this major pain keeps showing up. Funny thing is it just all of a sudden starts doing this and NONE of the solutions does anything to fix it. I am using Nexus 5X API 28x86 and now I've wasted hours already trying to fix it. Restarted everything including rebooting the computer.Parity
what if there are no processes listed?Closelipped
@Closelipped it is the solution for waiting state for the process.Prothalamion
@RohitKumar I know but I only see devices in the attach debugger, but no processes to select :/Closelipped
@Closelipped then the app is still waiting for the device to install, this is after thatProthalamion
@RohitKumar nope the app is already installed :/ this after it's installed and opens, then there's a splash screen and then nothing - the nothing I would like to debug, but it stops on the waiting on the splash screen :/Closelipped
@Closelipped check your logcat, if there is a process attached, it means you can attach debugger to that processProthalamion
T
24

Debugger stopped connecting for me today and nothing worked until I tried the following:

Go to Run, Edit-Configurations, Miscellaneous Tab, uncheck 'skip installation if APK has not changed' Apply, OK.

Debugger started to connect again.

Tittup answered 29/6, 2016 at 17:27 Comment(2)
Fudge, this worked for me when other answers did not work (restarting, deleting ".idea", etc). This answer is more than 5-years old and I am using the latest version of AS at the end of 2021. Why haven't Google fixed this issue? Even if they could not figured out the root cause, they could have easily make AS ignore that setting and install the APK if debugging keeps failing (unresponsive) for a certain amount of time....Eclosion
For me it was checking "Automatically attach on Debug.waitForDebugger()" in the "Debugger" tab. After Settings | Developer Options | Debugging and "Select debug app" and "Wait for debugger" on the device. At least I'm getting back into the debugger when the app restarts after a low memory shutdown now.Ison
W
24

A similar question has been asked recently and the solution may work for some and is very quick.

Clearing the Intellij IDEA (Android Studio) .idea directory which contains configuration information worked for me:

  1. Exit Android Studio
  2. Navigate to the project you are trying to debug
  3. Backup any files inside .idea that you modified (if your project checks any of these into VCS)
  4. Delete .idea directory
  5. Open the project in Android Studio
Wyatan answered 19/1, 2017 at 19:9 Comment(5)
This solved the problem. Suddenly I couldn't debug on real hardware or the emulator. Rebooting everything didn't work. I could get by using Run -> Attach debugger to Android process, but it gets annoying after a while. It started happening after upgrading gradle, as the IDE suggested.Bump
FYI ticket in google issue tracker: issuetracker.google.com/issues/37117600Wyatan
standard answer to all android studio issues, reboot :). windws os in the making..Brunet
Didn't help. The message persists.Fendig
Thank you vman! I was sweating bullets. Not being able to debug is a disaster for me and this solved it.Thera
D
23

This problem occurs when you open more than one instance of Android studio, so you need to attach the debugger manually like mentioned above.

You may need to close other instances of Android studio.

Dimarco answered 13/7, 2017 at 18:0 Comment(3)
One thing to add: Maybe your have to restart android studio after closing the open instanc(es)... This helped me!Tempestuous
Another improvement - it does happen if you have just another IntelliJ IDEA open. Not need to be android studioAlcoholic
Android Studio was unable to start debugging in an Android Emulator, and closing IntelliJ solved the problem. The project opened in IntelliJ was not even an Android project (but just a console Kotlin project). Maybe it is because the Android component is installed in IntelliJ.Eclosion
H
16

I faced this problem in android studio 3.0. Just restarted device solved.

Harness answered 30/5, 2018 at 6:28 Comment(1)
thanks you save my day its working fine.Official
L
13

I tried the top three rated answers but failed. After rebooting my mobile, the problem is solved. No more long "Waiting for Debugger".

Literalminded answered 26/5, 2018 at 11:17 Comment(0)
R
12

Both of my dev machines have JDK 8 installed, the debugging function is restored once JDK 7.0.71 was installed and JAVA_HOME environmental variable was set to point to the new JDK.

Guess there's some compatibility issue between Android Studio + ADB + JDK8 (Eclipse + ADB + JDK8 works fine).

Ruthi answered 14/12, 2014 at 7:2 Comment(7)
I have the same problem, very annoying since requires phone reboot. Using JDK 1.7.0b147Kandace
JDK 8 is not officially supported by Android Studio - I have had problems compiling projects and they were resolved by going back to JDK 7.Gluck
where to change the version of JDK8 to JDK7 in latest version of Android StudioHalves
@AnandKrish you have to change the default JDK/JRE of the computing environment, basically when you execute javac -version, the result should be javac 1.7.xxx. On the other hand, I'm using JDK 8 (1.8.0_60) on OSX and the aforementioned issue doesn't seem to exist anymore.Ruthi
Correct! My machine have JDK 7 and JDK 8 installed. I have resolved this issue by change JDK location (Android Studio 2.1.1: File - Project Structure - SDK Location - JDK location) from JDK 8 to JDK 7.Harbaugh
Just a note - the current version of Android Studio, 2.2.3, indicates that JDK 8 is required, so this is no longer the correct answer for those on the latest version.Labionasal
I switched back to the embedded version (recommended) thru Project structure as suggested above - and that fixed the issue hanging on "collecting data". ThanksPym
I
8

This fixed it for me. Android Studio -> File -> Invalidate Caches & Restart...

Infantilism answered 21/9, 2017 at 0:15 Comment(0)
M
8

I just managed this problem, after several days of trying the above solutions. So I closed the emulator, run AVD manager and in device menu choose - "wipe data" So in next run I was free from stucked debugger. AVD manager

Murrumbidgee answered 9/5, 2018 at 20:41 Comment(0)
C
6

When the Device displays the message go to Run->Attach debbuger, then select a debbuger. it'll start the activity.

Curlew answered 31/10, 2016 at 20:31 Comment(2)
Too annoying. This just started happening today after YEARS of successful debugging with no problems.Bostick
I solved it by factory restoring my device. I need to get rid of it the as soon as possible.Curlew
S
6

I had the same problem. Restart my android phone device worked for me.

Stillness answered 15/1, 2021 at 7:26 Comment(1)
Only answer that worked for me. Probably the right answer for people facing our version of the issue.Yance
D
6

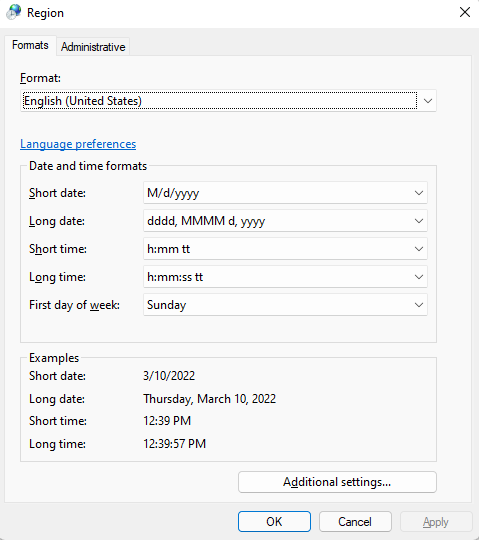
For me, the issue was: The Regional Format of Windows was ARABIC. I simply changed the regional format to English (United States) and the error has fixed.

Steps to fix:

  1. Go to Start -> type Region -> click on Region to open Region window -> from the Format dropdown, select English (United Stated) -> Click OK.
  2. Restart Android Studio.

Region window

Dictatorial answered 10/3, 2022 at 10:1 Comment(4)
I also got the same issue with 'Persian' regional format. I faced this issue in newer version of android studio i.e. Android Studio Electric Eel | 2022.1.1 Patch 2 while I had no problem with Android Studio 3.5.3 2019 on the same machine and same configuration.Epigrammatize
@Epigrammatize Did this answer solve your issue?Dictatorial
Yes, it fixed lots of problems. The app still waits for the debugger, but the situation is now much better after this change.Epigrammatize
I also got the same issue with 'Persian' regional format with Android Studio Flamingo | 2022.2.1 Patch 2. It was Weird but I spent 8 hours to found this solution. Thank You ☺Apiarian
S
5

This solution works for me:

turning off the USB debugging from my device settings , and then turning it on again.

its Much quicker and easier than restart the device.

Selenite answered 2/7, 2016 at 6:53 Comment(0)
S
4

How it worked for me.

1 Start Android Device Monitor from Tools -> Android -> Android Device Monitor

2 Click on Stop for the process you are facing the issue from list of devices.

Sordid answered 4/3, 2017 at 18:25 Comment(0)
C
4

This also happens to me from time to time. Problem is that your app / device is configured to wait for debugger. In this case it is waiting for debugger before continuing execution of.

Option 1:

Attach debugger or run in debug mode. You can do this in Android Studio. Buttons to attach debugger and run in debug mode are located next to normal run mode (Bug and Bug with arrow).

Option 2:

Disable Wait for debugger. You can do this is developer settings. This option needs to be disabled in:
  1. Root of Developer Options
  2. Developer options -> Select debug app -> -> Wait for debugger

This was tested on Android emulator in android studio. Other phones might have this setting different. If you can not find app's settings in debug, reinstalling app might work too.

Cayes answered 18/11, 2021 at 9:44 Comment(1)
It's perfect solutionMuskellunge
A
3

As for my case, running Android Studio Canary (preview release) along with the stable version was the problem. Running multiple instances of the same Android Studio flavor was OK, but mixing them often resulted in "Waiting For Debugger".

Apropos answered 4/11, 2020 at 19:22 Comment(1)
This is also true when running IntelliJ Idea. You can't even attach the debugger.Albescent
P
2

Most of the times this is caused because of the overload of resources and threads over the emulator. Or even for the lock of objects that GC couldn't set free: http://developer.android.com/intl/pt-br/tools/debugging/index.html

Usually, a single restart of it will solve the issue, but sometimes it asks for the IDE restart, so be sure to make both tests.

Another good test is trying to start the app in "Start mode" and then try the debug mode again...

P.S: Don't forget to kill each debug process in the IDE after each test. This will prevent your env to be more overloaded.

Prospector answered 20/3, 2016 at 15:0 Comment(0)
T
2

Got it fixed according this solution: https://youtrack.jetbrains.com/issue/IDEA-166153
I opened <project dir>/.idea/workspace.xml replaced all the
<option name="DEBUGGER_TYPE" value="Auto" /> occurrences to
<option name="DEBUGGER_TYPE" value="Java" />
and restarted Android Studio

Triacid answered 8/10, 2017 at 20:5 Comment(1)
Thank you, this is the only thing that fixed my issue, which started happening after including exoplayer locally in my project.Portulaca
S
2

Open Command prompt and go to android sdk>platform-tools> adb kill-server

press enter

and again adb start-server

press enter

Schrader answered 19/11, 2017 at 20:13 Comment(0)
O
2

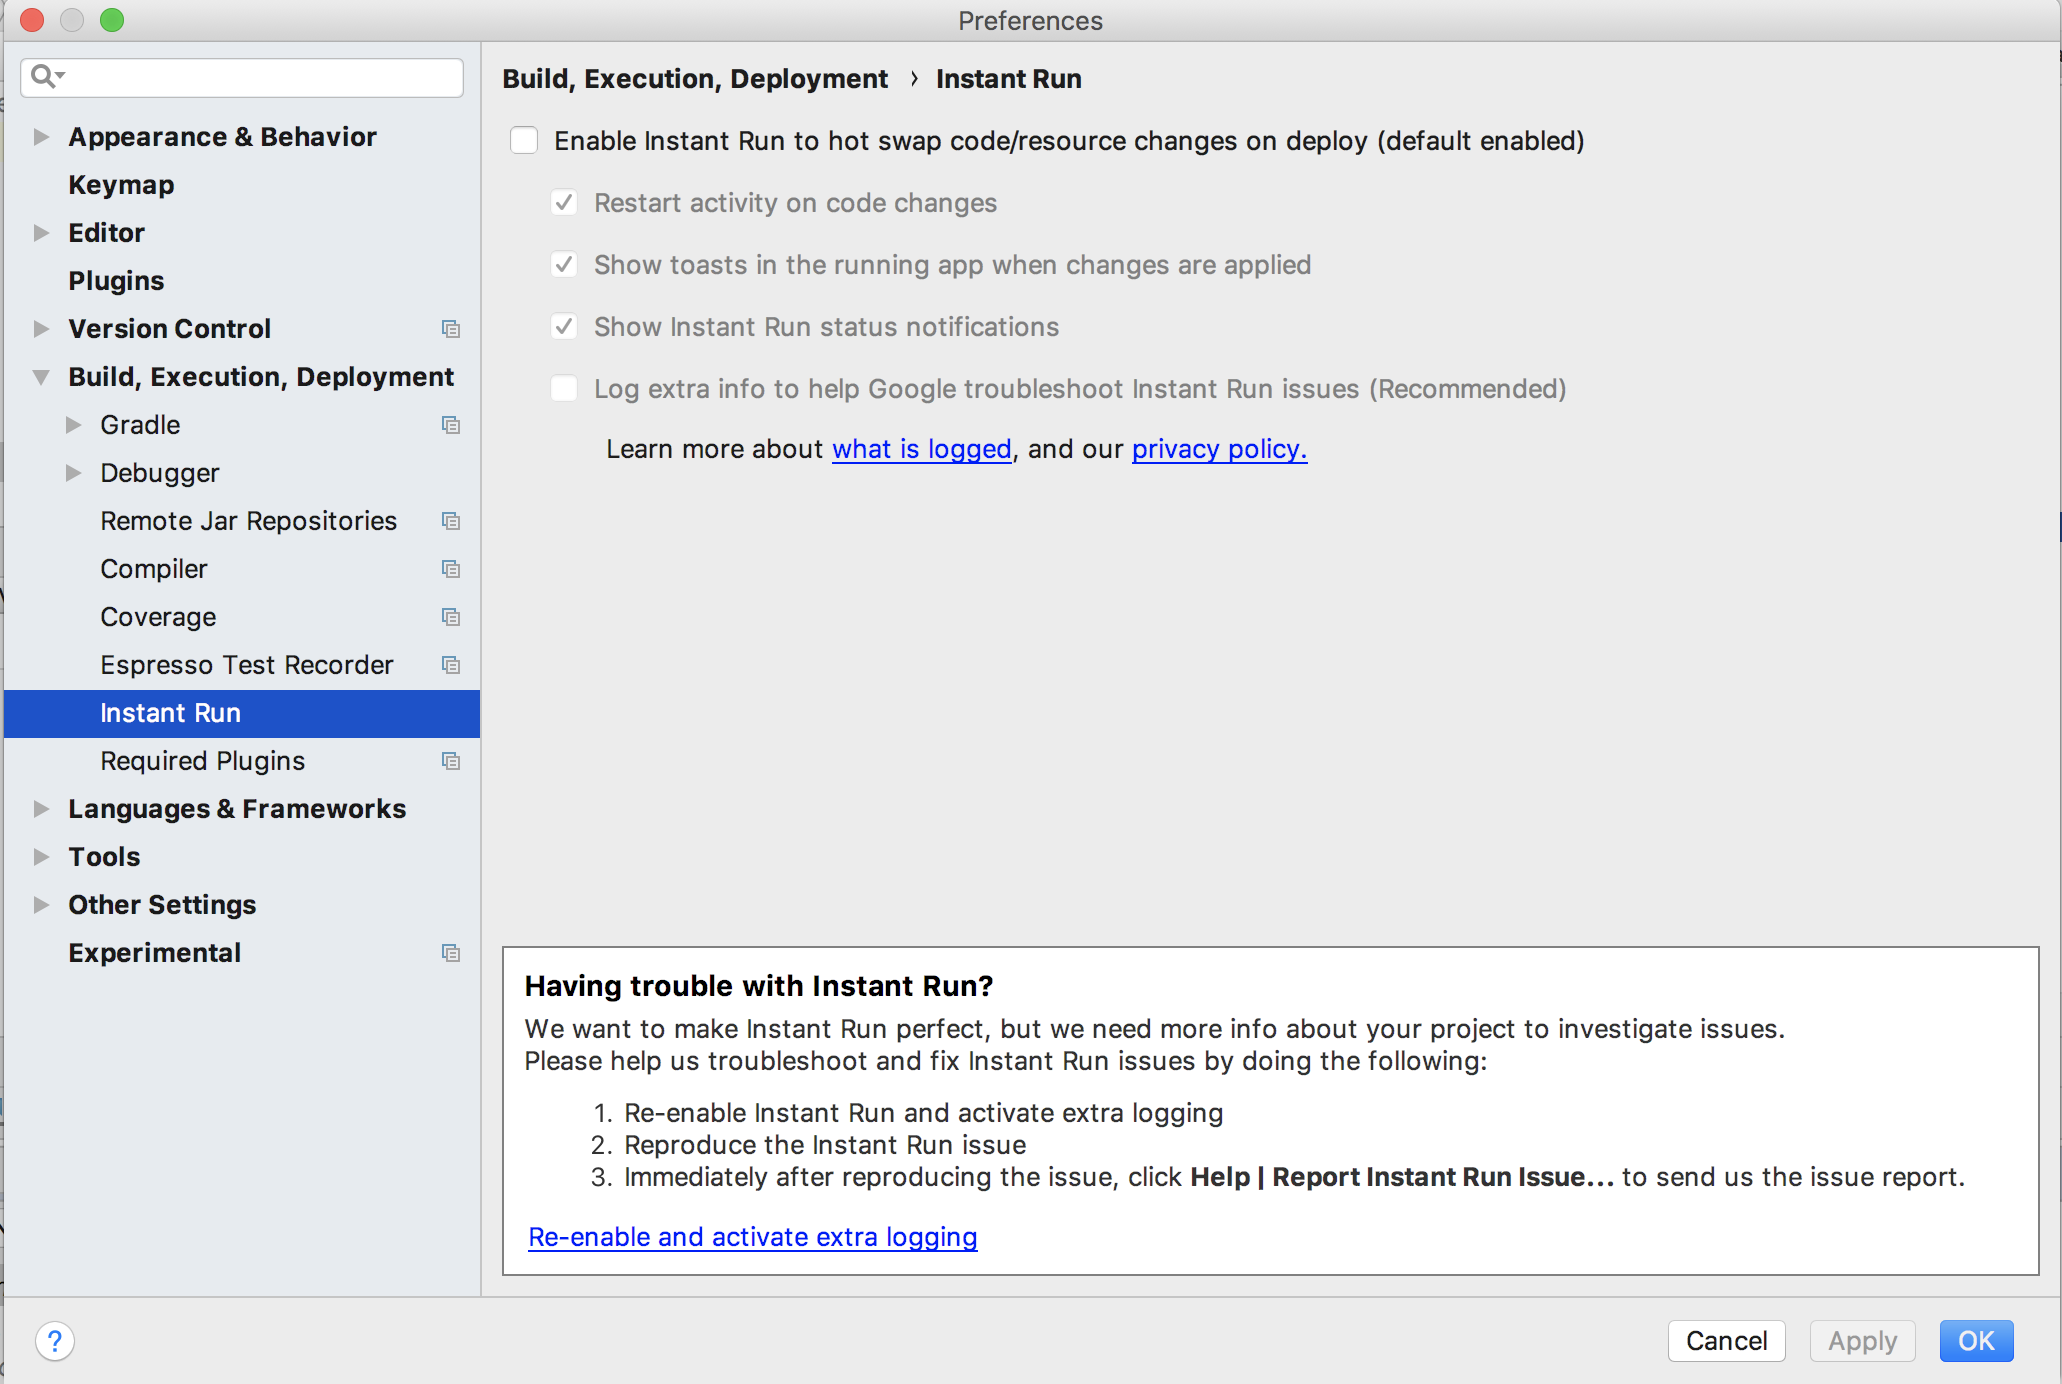
Android studio 3.0 and Above

Disable the instant Run

enter image description here

Oberammergau answered 11/7, 2018 at 13:51 Comment(1)
With Android Studio 3.5.x, this option becomes HotSwap.Circumnutate
E
2

Tried all the solutions given here but restarting my laptop worked for me.

Eidson answered 21/4, 2022 at 0:32 Comment(1)
next time, try getting a new laptop, it works even betterMcginley
C
1

I had the same problem. Restart my android device and closed the adb.exe process. With that I could solve the problem

Constant answered 29/1, 2016 at 2:50 Comment(0)
V
1

Well, I guess there is a plethora of circumstances that can trigger this issue. I'm using IntelliJ Idea instead, but it's mostly the same than Android Studio. My solution for this problem:

Fastest way:

Right click on the class file that contains the main activity of your project, and then on "Debug 'WhateverActivity'". This will create a new run configuration that should debug fine.

Other solution, without creating a new run configuration:

  1. Open Run/Debug configurations and within "Android app" pick the configuration you're using to debug your app.
  2. Locate "Launch Options/Launch" there and set it to "Specified Activity" instead of "Default Activity".
  3. In the "Launch" field just below the aforementioned option, click on the three ellipsis (three dots) button and select your main activity.

At least it worked for me. I hope it works for others too.

Viewless answered 17/8, 2017 at 11:3 Comment(1)
As a side note, beware with USB hubs and low quality USB cables. I've experienced this sort of problem due these too.Viewless
B
1

Non of this solutions worked for me.

In my case was that I was debugging an App from Intellij IDEA and at the same time with Android Studio. By just closing the Intellij IDEA and removing the app I was debugging just fixed my problem.

Bearcat answered 8/3, 2018 at 15:34 Comment(0)
S
1

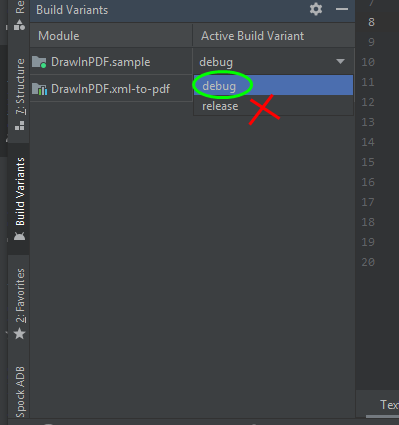
Make sure that your Active Build Variant is debug.

enter image description here

If you also want to make your release variant APK debuggable then make a simple change in app level build.gradle -

buildTypes {
        release {
            debuggable true
            /*Your rest code*/
        }
    }
Stagnant answered 9/3, 2021 at 17:47 Comment(0)
M
1

Change your time zone and region format. unfortunately, some regions are restricted.

Missend answered 1/9, 2022 at 4:13 Comment(0)
D
1

For me the problem was having IntelliJ open at the same time as Android Studio. I was using IntelliJ for back-end development at the same time as Android Studio for app development. Even though I was not doing any mobile device work with IntelliJ, it broke debugging in Android Studio.

Solution: Shutdown IntelliJ when debugging with Android Studio.

Duckbill answered 17/1, 2023 at 1:35 Comment(0)
S
1

Solution using the Terminal

Using @twlkyao answer I entered in the terminal:

adb shell am clear-debug-app

And the response was:

adb.exe: more than one device/emulator

Then, taking a hint from @kudzai zishumba answer, I entered:

adb kill-server

And that cured my problem. I'm surmising that the debugger was attached to the emulator and also to my phone. It's my phone I'm wanting to run debug on, not the emulator.

Splasher answered 18/5, 2023 at 3:9 Comment(0)
R
1
  1. Enable Developer Options: Ensure that Developer Options are enabled on your Android device. To enable Developer Options, go to Settings -> About Phone -> Tap on Build Number multiple times until you see a message confirming that Developer Options are enabled.

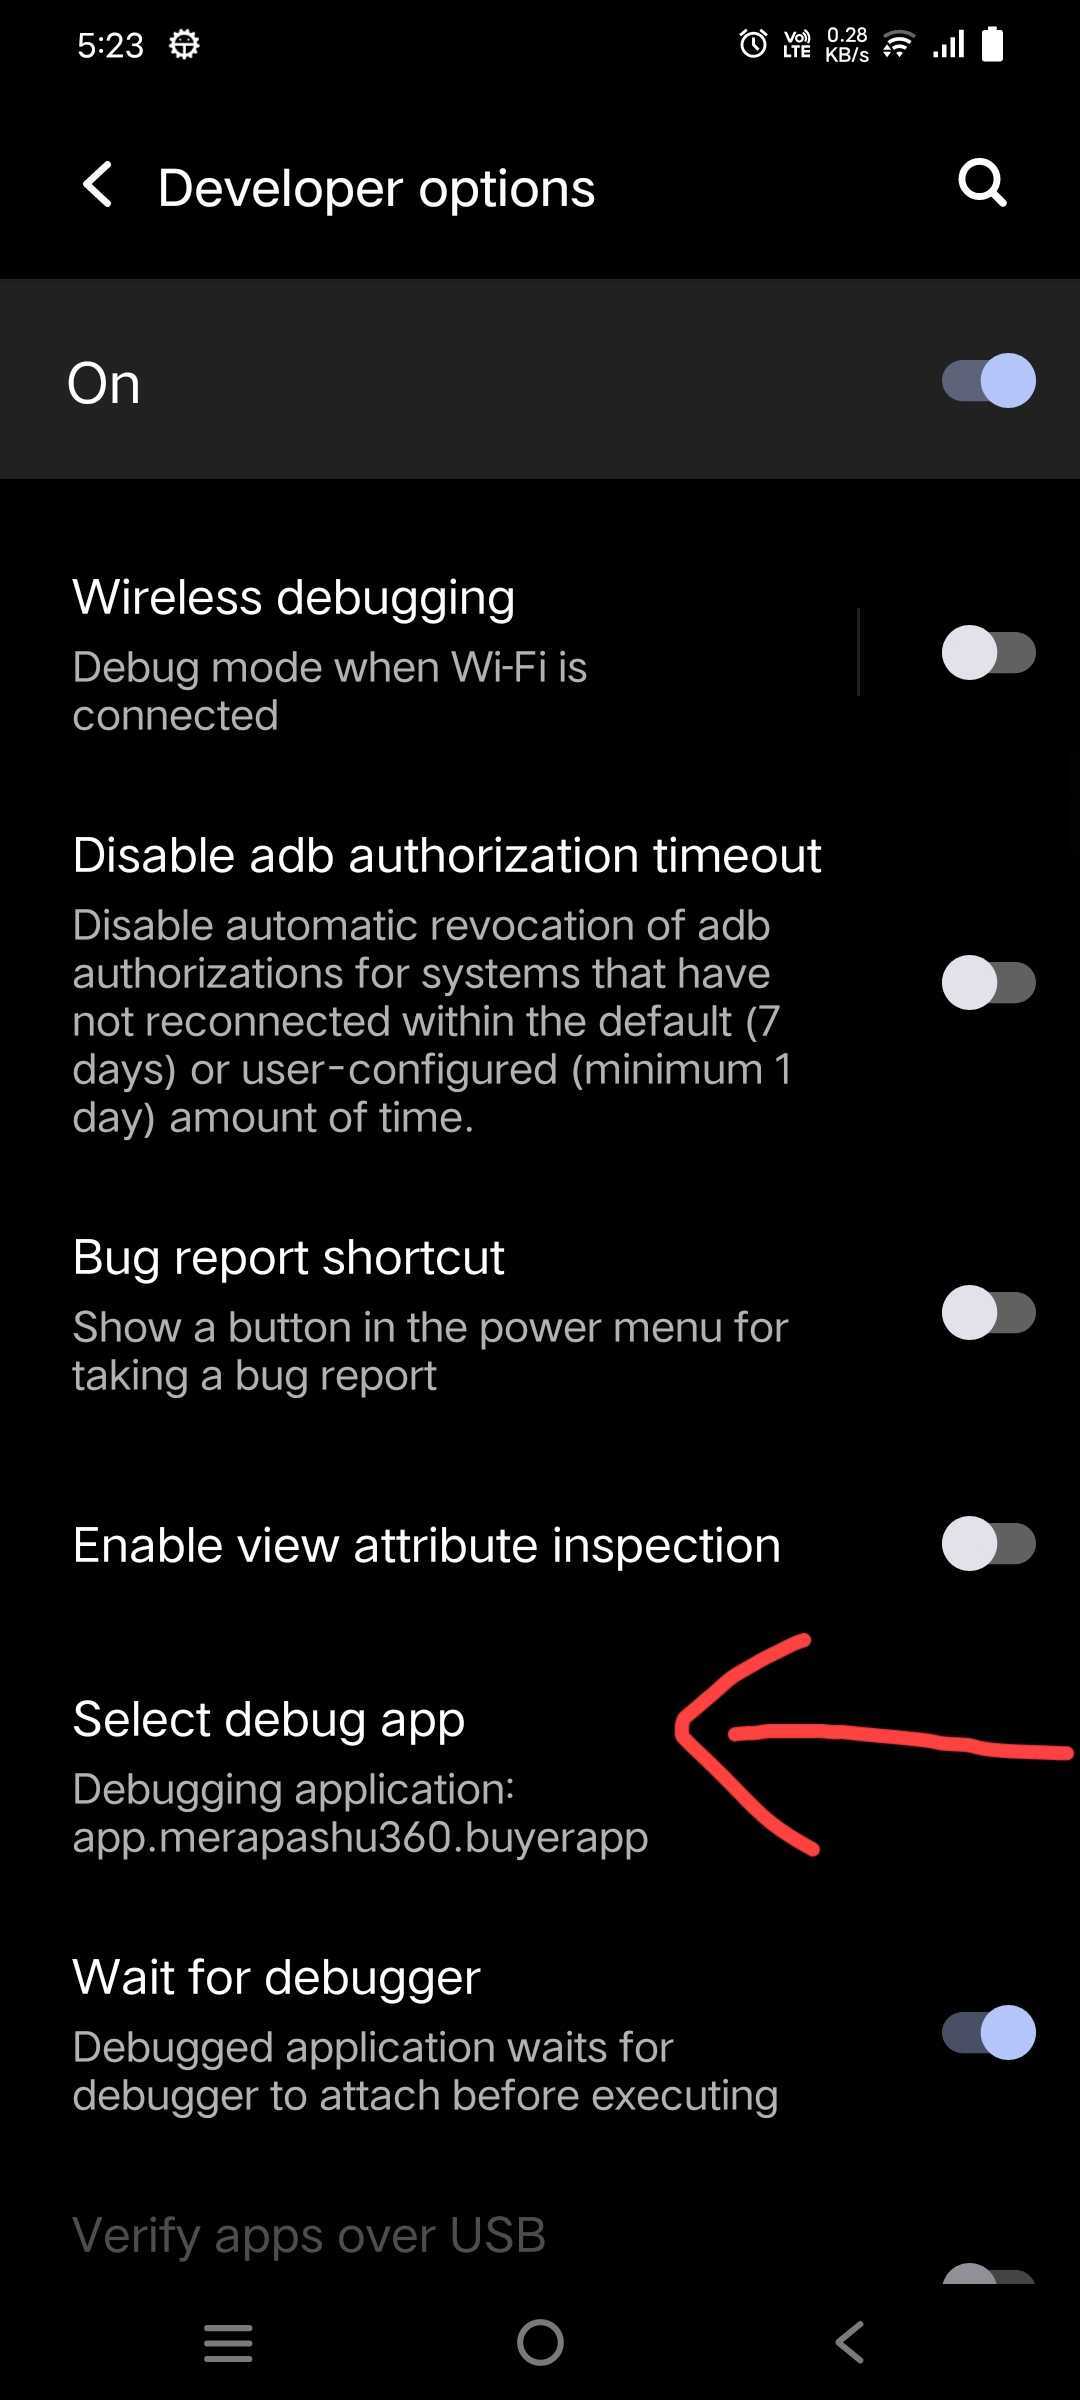
  2. Select Debug App:

In Developer Options, find and select the "Select debug app option". Choose the app that is causing the debugger attachment issues.

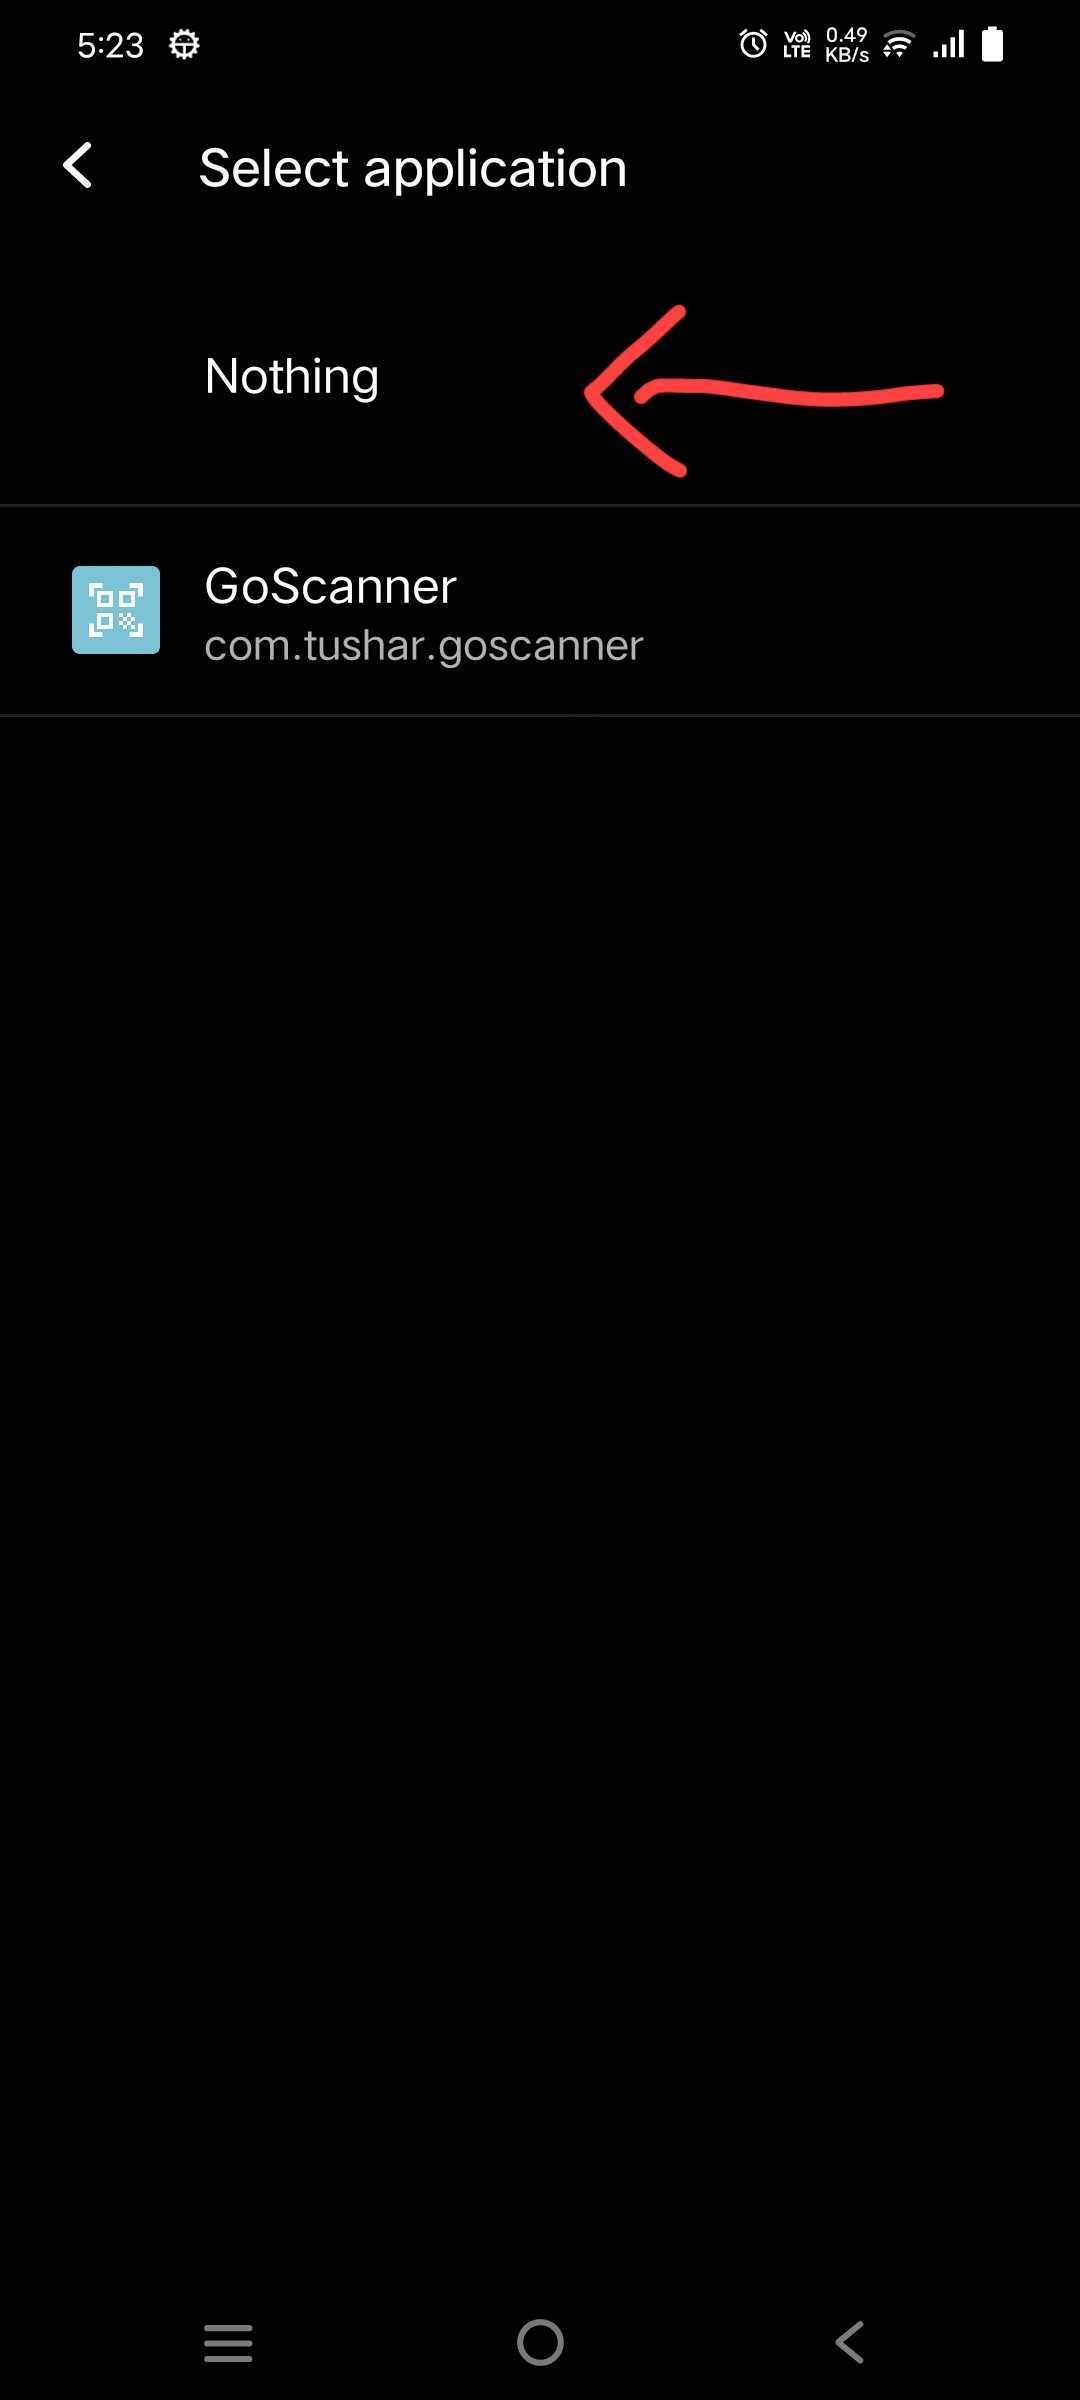
  1. Select "Nothing" Option:

When prompted to select the debugging app, choose the "Nothing" option.

Below are some screenshots :

Select Debug App option

Select Nothing

Raybin answered 2/2 at 12:6 Comment(0)
M
0

Restarting everything didn't work for me. What DID work was waiting for a few minutes while Android Studio unclogged itself. This was the first time I ran the debugger; after that, Android Studio fired up the debugger quickly.

Manzoni answered 2/9, 2016 at 6:9 Comment(0)
T
0

For me Run->Attach debugger to Android process was working, but I had to do it every time app was launched.

Fix: There may be a problem with your 'App launch configuration'(To verify this create new project to see if it's working fine). Just delete app configuration, open MainActivity file and Run->Debug (new conffiguration will be created)

Truncation answered 13/1, 2017 at 5:41 Comment(0)
H
0

Sometime it's due to the fact that in the build.gradle configuration you have to set the node:

  debug {
            debuggable true
        }

Change it back to false when you have to prepare the signed apk.

Regards

Henig answered 22/2, 2018 at 19:17 Comment(0)
I
0

It has happened to me that it stayed stuck in "Waiting for Debugger" when accidentally I tried to Debug a Release build, sometimes it warns that it is not a debug build and others it silently stucks in "Waiting for Debugger".

The solution is obviously to switch to Debug build

Illailladvised answered 24/6, 2018 at 14:3 Comment(0)
C
0

For my case, I have to reinstall the AVD.

Cauley answered 27/7, 2021 at 12:26 Comment(0)
R
0

Seems this is another Android Studio bug. To prevent this problem return back to Android Studio v4.1.3 (4.1.1) or earlier and use Android Gradle Plugin Version 4.1+ and Gradle Version 6.6 . After this, android studio works fine. Say if this answer is useful, Thanks.

Reverent answered 4/9, 2021 at 10:55 Comment(0)
A
0

In my Linux Ubuntu Android Studio development environment, entirely deleting my configuration folder, ~/.config/Google/AndroidStudio2021.1, and restarting Android Studio was the only way to restore native debugging ability.

Atahualpa answered 15/2, 2022 at 16:5 Comment(0)
G
0

Toggling airplane mode on the device fixed it for me (without doing a reset)

Gestapo answered 24/11, 2023 at 6:41 Comment(0)
C
0

In my case manually deleting the previously installed app(package) solved the issue: adb shell pm list packages adb uninstall com.something.myapp.test

Collaboration answered 7/2 at 12:27 Comment(0)
T
-3

If all else fails, try "Clean Storage" via the app's System Settings.

Territus answered 24/2, 2019 at 12:9 Comment(2)
System Settings is not part of an app.Fendig
launcher > Settings > Apps > my_app > Storage > Clean storageTerritus

© 2022 - 2024 — McMap. All rights reserved.