How to add value labels to a boxplot using the hue argument
Asked Answered
L

2

9

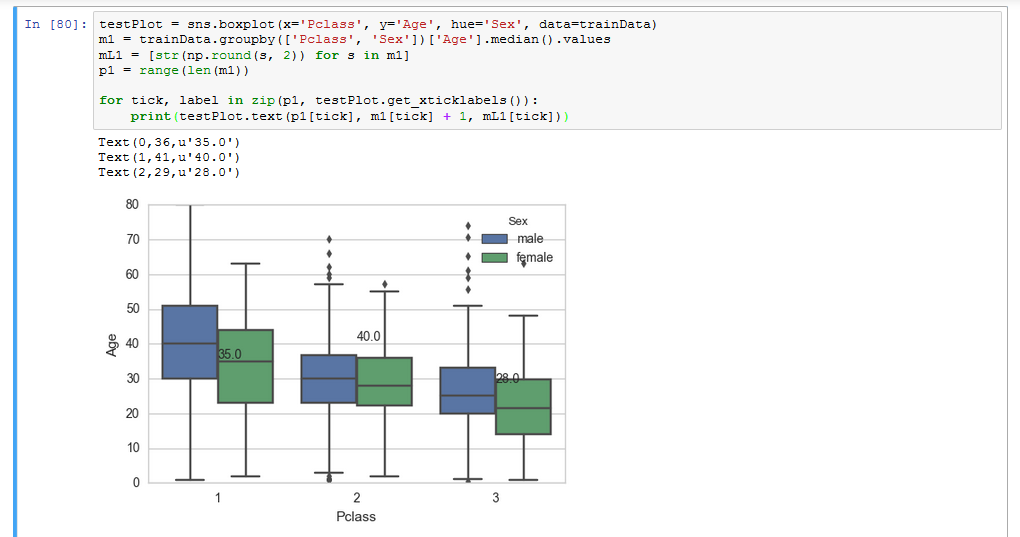
In addition to the solution posted in this link I would also like if I can also add the Hue Parameter, and add the Median Values in each of the plots.

The Current Code:

testPlot = sns.boxplot(x='Pclass', y='Age', hue='Sex', data=trainData)
m1 = trainData.groupby(['Pclass', 'Sex'])['Age'].median().values
mL1 = [str(np.round(s, 2)) for s in m1]
p1 = range(len(m1))

for tick, label in zip(p1, testPlot.get_xticklabels()):
    print(testPlot.text(p1[tick], m1[tick] + 1, mL1[tick]))

Gives a Output Like: enter image description here

I'm working on the Titanic Dataset which can be found in this link.

I'm getting the required values, but only when I do a print statement, how do I include it in my Plot?

Lection answered 3/8, 2017 at 5:57 Comment(1)
A more improved answer that the here accepted can be found here.Shelve
E
15

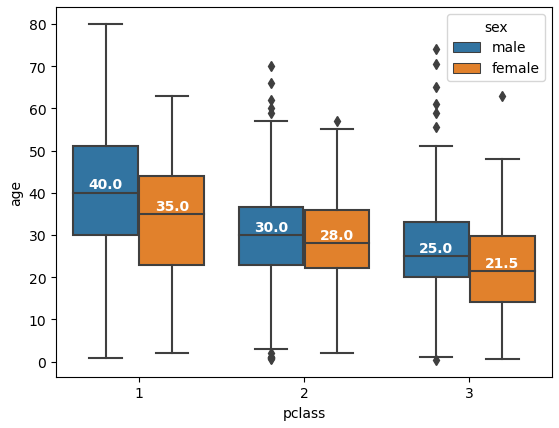
Place your labels manually according to hue parameter and width of bars for every category in a cycle of all xticklabels:

import seaborn as sns
import pandas as pd
import numpy as np
import matplotlib.pylab as plt

trainData = sns.load_dataset('titanic')
testPlot = sns.boxplot(x='pclass', y='age', hue='sex', data=trainData)
m1 = trainData.groupby(['pclass', 'sex'])['age'].median().values
mL1 = [str(np.round(s, 2)) for s in m1]

ind = 0
for tick in range(len(testPlot.get_xticklabels())):
    testPlot.text(tick-.2, m1[ind+1]+1, mL1[ind+1],  horizontalalignment='center',  color='w', weight='semibold')
    testPlot.text(tick+.2, m1[ind]+1, mL1[ind], horizontalalignment='center', color='w', weight='semibold')
    ind += 2    
plt.show()

enter image description here

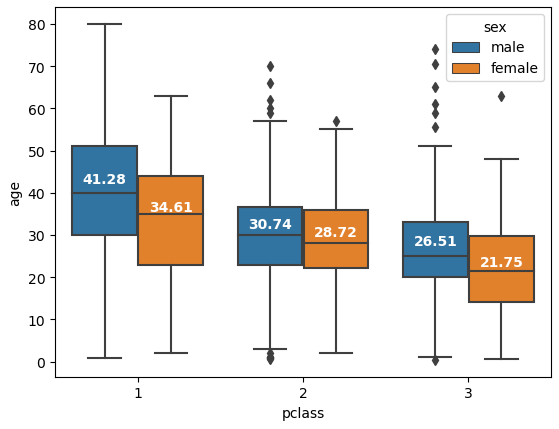
For alternative statistical measurements, such as mean, update m1 to use the appropriate method.

m1 = trainData.groupby(['pclass', 'sex'])['age'].mean().values  # mean instead of median

enter image description here

Elaterin answered 3/8, 2017 at 6:28 Comment(0)
S
1

This answer is nearly copy & pasted from here but fit more to your example code. The linked answer is IMHO a bit missplaced there because that question is just about labeling a boxplot and not about a boxplot using the hue argument.

I couldn't use your Train dataset because it is not available as Python package. So I used Titanic instead which has nearly the same column names.

#!/usr/bin/env python3
import pandas as pd
import matplotlib
import matplotlib.patheffects as path_effects
import seaborn as sns

def add_median_labels(ax, fmt='.1f'):
    """Credits: https://mcmap.net/q/359784/-labeling-boxplot-in-seaborn-with-median-value
    """
    lines = ax.get_lines()
    boxes = [c for c in ax.get_children() if type(c).__name__ == 'PathPatch']
    lines_per_box = int(len(lines) / len(boxes))
    for median in lines[4:len(lines):lines_per_box]:
        x, y = (data.mean() for data in median.get_data())
        # choose value depending on horizontal or vertical plot orientation
        value = x if (median.get_xdata()[1] - median.get_xdata()[0]) == 0 else y
        text = ax.text(x, y, f'{value:{fmt}}', ha='center', va='center',
                       fontweight='bold', color='white')
        # create median-colored border around white text for contrast
        text.set_path_effects([
            path_effects.Stroke(linewidth=3, foreground=median.get_color()),
            path_effects.Normal(),
        ])


df = sns.load_dataset('titanic')
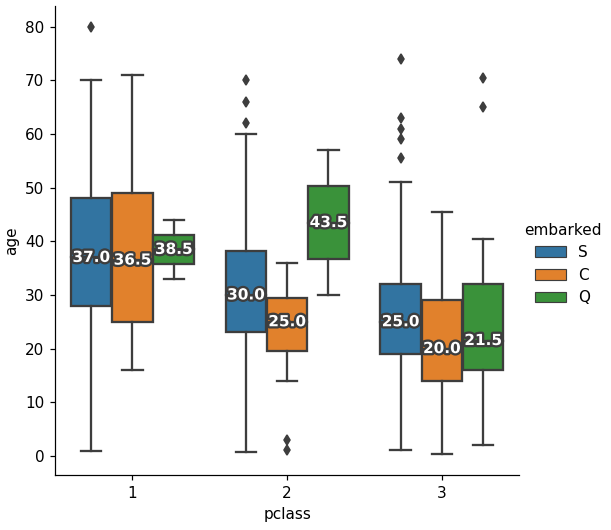
plot = sns.boxplot(x='pclass', y='age', hue='sex', data=df)
add_median_labels(plot)
plot.figure.show()

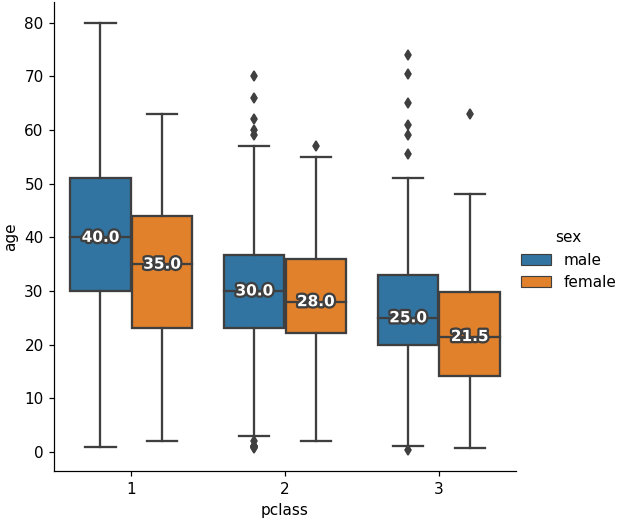
Als an alternative when you create your boxplot with a figure-based function. In that case you need to give the axes parameter to add_median_labels().

# imports and add_median_labels() unchanged
df = sns.load_dataset('titanic')
plot = sns.catplot(kind='box', x='pclass', y='age', hue='sex', data=df)
add_median_labels(plot.axes[0][0])
plot.figure.show()

The resulting plot enter image description here

This solution also works with more then two categories in the column used for the hue argument.

enter image description here

Shelve answered 22/11, 2022 at 7:44 Comment(0)

© 2022 - 2024 — McMap. All rights reserved.