Labeling boxplot in seaborn with median value
Asked Answered
S

3

47

How can I label each boxplot in a seaborn plot with the median value?

E.g.

import seaborn as sns
sns.set_style("whitegrid")
tips = sns.load_dataset("tips")
ax = sns.boxplot(x="day", y="total_bill", data=tips)

How do I label each boxplot with the median or average value?

Seal answered 29/7, 2016 at 2:13 Comment(0)
B
83

I love when people include sample datasets!

import seaborn as sns

sns.set_style("whitegrid")
tips = sns.load_dataset("tips")
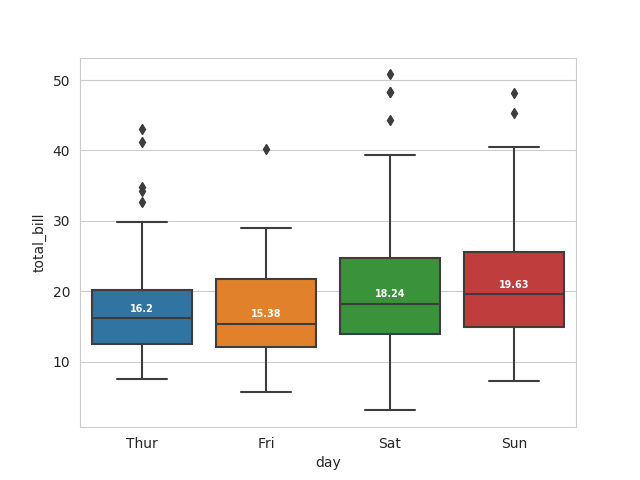
box_plot = sns.boxplot(x="day",y="total_bill",data=tips)

medians = tips.groupby(['day'])['total_bill'].median()
vertical_offset = tips['total_bill'].median() * 0.05 # offset from median for display

for xtick in box_plot.get_xticks():
    box_plot.text(xtick,medians[xtick] + vertical_offset,medians[xtick], 
            horizontalalignment='center',size='x-small',color='w',weight='semibold')

enter image description here

Bedaub answered 29/7, 2016 at 3:9 Comment(3)
Note that the effect of 0.5 after medians[tick] is sensitive to the scale of one's data. For my small scale, it pushed the white text up into the white background and it took me a while to figure out why it wasn't showing. Scale 0.5 as needed.Bridgettbridgette
note: the np.round(s, 2) above can be replaced with just s; and moreover, the zip() and get_xticklabels() commands are unnecessary here. The trick here is that the placement of each label is determined by the median value itself (as y value), and the categorical labels (which, I guess, are represented by integers along the x axis) (as x value). Extracting the xticklabels could be helpful if the info you want to annotate with is stored in a data frame, since you could then use the xticklabels for indexing.Intro
HA! +1 for I love when people include sample datasets!. Me too.Purpura
C
46

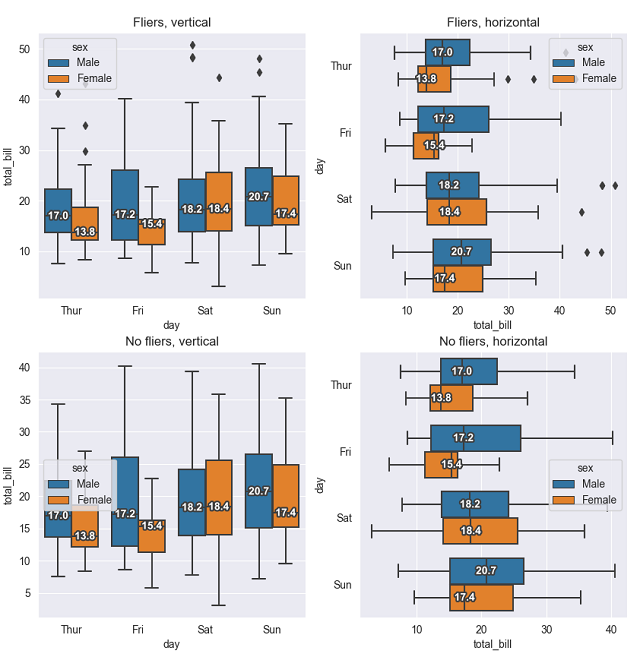
Based on ShikharDua's approach, I created a version which works independent of tick positions. This comes in handy when dealing with grouped data in seaborn (i.e. hue=parameter). Additionally, I added a flier- and orientation-detection.

grouped data with median labels in multiple formats

import seaborn as sns
import matplotlib.pyplot as plt
import matplotlib.patheffects as path_effects


def add_median_labels(ax: plt.Axes, fmt: str = ".1f") -> None:
    """Add text labels to the median lines of a seaborn boxplot.

    Args:
        ax: plt.Axes, e.g. the return value of sns.boxplot()
        fmt: format string for the median value
    """
    lines = ax.get_lines()
    boxes = [c for c in ax.get_children() if "Patch" in str(c)]
    start = 4
    if not boxes:  # seaborn v0.13 => fill=False => no patches => +1 line
        boxes = [c for c in ax.get_lines() if len(c.get_xdata()) == 5]
        start += 1
    lines_per_box = len(lines) // len(boxes)
    for median in lines[start::lines_per_box]:
        x, y = (data.mean() for data in median.get_data())
        # choose value depending on horizontal or vertical plot orientation
        value = x if len(set(median.get_xdata())) == 1 else y
        text = ax.text(x, y, f'{value:{fmt}}', ha='center', va='center',
                       fontweight='bold', color='white')
        # create median-colored border around white text for contrast
        text.set_path_effects([
            path_effects.Stroke(linewidth=3, foreground=median.get_color()),
            path_effects.Normal(),
        ])


tips = sns.load_dataset("tips")

ax = sns.boxplot(data=tips, x='day', y='total_bill', hue="sex")
add_median_labels(ax)
plt.show()
Chouinard answered 7/8, 2020 at 5:39 Comment(2)
Your solution is awesome and I try to figureing out the details. You access the "data" via median.get_data() and median.get_xdata(). Is there also a generalized way to get the number of values (n) for each box; or other values like mean(), stdev()?Semitrailer
Unfortunately not. All I work is what "is visible to the eye", i.e. the coordinates of the box and its lines. Everything else is lost by that point. One way to get the statistics is to get a description by pandas in a separate step (see e.g. https://mcmap.net/q/372057/-how-can-i-get-statistics-values-from-a-boxplot-when-using-seaborn)Chouinard
A
32

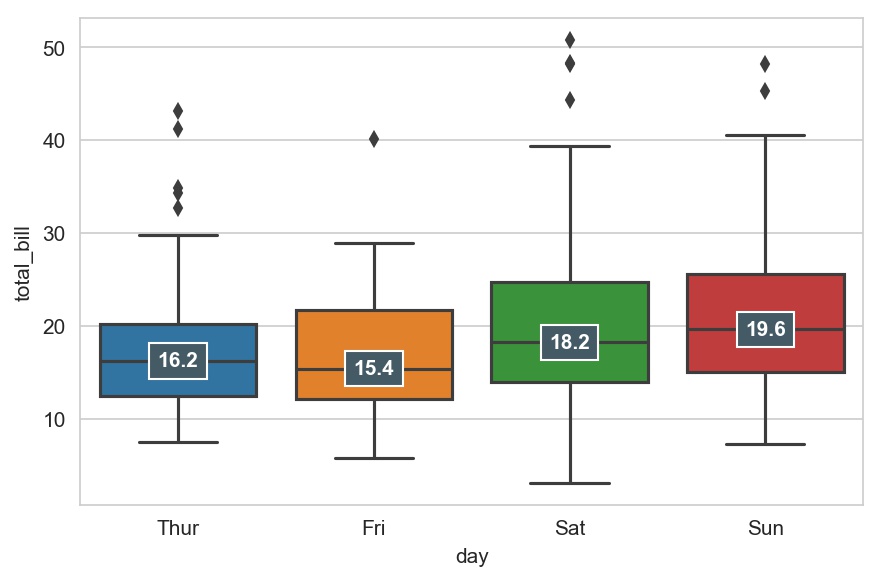
This can also be achieved by deriving median from the plot itself without exclusively computing median from data

box_plot = sns.boxplot(x="day", y="total_bill", data=tips)

ax = box_plot.axes
lines = ax.get_lines()
categories = ax.get_xticks()

for cat in categories:
    # every 4th line at the interval of 6 is median line
    # 0 -> p25 1 -> p75 2 -> lower whisker 3 -> upper whisker 4 -> p50 5 -> upper extreme value
    y = round(lines[4+cat*6].get_ydata()[0],1) 

    ax.text(
        cat, 
        y, 
        f'{y}', 
        ha='center', 
        va='center', 
        fontweight='bold', 
        size=10,
        color='white',
        bbox=dict(facecolor='#445A64'))

box_plot.figure.tight_layout()

enter image description here

Alum answered 3/7, 2019 at 23:43 Comment(2)
works great! One remark: if fliers are disabled, the interval changes from 6 to 5 (due to the missing flier-"line"). So now I have to think about a technique how to get this working for data grouped via hue values...Chouinard
Can you also figuring out the n per box?Semitrailer

© 2022 - 2024 — McMap. All rights reserved.