in python, how to connect points with smooth line in plotting?
Asked Answered
T

2

9

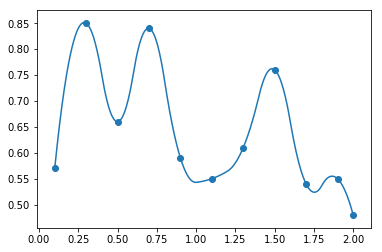
I am trying to plot points + smooth line using spline. But the line "overshoots" some points, e.g in following codes, over the point 0.85.

import numpy as np 
import matplotlib.pyplot as plt
from scipy.interpolate import spline

x=np.array([0.1, 0.3, 0.5, 0.7, 0.9, 1.1, 1.3, 1.5, 1.7, 1.9, 2])
y=np.array([0.57,0.85,0.66,0.84,0.59,0.55,0.61,0.76,0.54,0.55,0.48])

x_new = np.linspace(x.min(), x.max(),500)
y_smooth = spline(x, y, x_new)

plt.plot (x_new,y_smooth)
plt.scatter (x, y)

how do I fix it?

Thrum answered 18/11, 2017 at 1:35 Comment(3)
monotonic interpolation would not overshoot, e.g. pchip. But it's unclear what you want exactly.Trillion
Possible duplicate of Plot smooth line with PyPlotTowhee
@CalderWhite No... he got an extra requirement / problem and the accepted answer there is exactly what he used and he described what's his problem with it.Trillion
C
15

You might try the using interp1d in scipy.interpolate:

import numpy as np 
import matplotlib.pyplot as plt
from scipy.interpolate import interp1d

x=np.array([0.1, 0.3, 0.5, 0.7, 0.9, 1.1, 1.3, 1.5, 1.7, 1.9, 2])
y=np.array([0.57,0.85,0.66,0.84,0.59,0.55,0.61,0.76,0.54,0.55,0.48])

x_new = np.linspace(x.min(), x.max(),500)

f = interp1d(x, y, kind='quadratic')
y_smooth=f(x_new)

plt.plot (x_new,y_smooth)
plt.scatter (x, y)

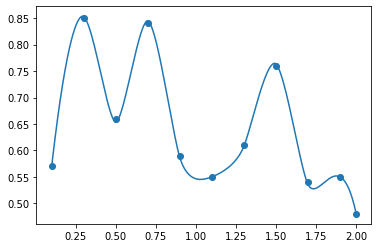
which yields:

enter image description here

some other options for the kind parameter are in the docs:

kind : str or int, optional Specifies the kind of interpolation as a string (‘linear’, ‘nearest’, ‘zero’, ‘slinear’, ‘quadratic’, ‘cubic’ where ‘zero’, ‘slinear’, ‘quadratic’ and ‘cubic’ refer to a spline interpolation of zeroth, first, second or third order) or as an integer specifying the order of the spline interpolator to use. Default is ‘linear’.

Clovah answered 18/11, 2017 at 1:53 Comment(0)
S
1

You could also try a thin plate spline using radial basis function interpolation from scipy:

import numpy as np 
import matplotlib.pyplot as plt
from scipy.interpolate import Rbf

x = np.array([0.1, 0.3, 0.5, 0.7, 0.9, 1.1, 1.3, 1.5, 1.7, 1.9, 2])
y = np.array([0.57,0.85,0.66,0.84,0.59,0.55,0.61,0.76,0.54,0.55,0.48])

x_new = np.linspace(x.min(), x.max(), 500)

rbf = Rbf(x, y, function = 'thin_plate', smooth = 0.001)
y_smooth = rbf(x_new)

plt.plot(x_new, y_smooth)
plt.scatter(x, y);

enter image description here

It may be possible to get a better approximation to the data by varying the smooth parameter.

Alternative function parameter values to consider include 'multiquadric', 'inverse', 'gaussian', 'linear', 'cubic' and 'quintic'. When considering the function value, I usually try 'thin_plate' first followed by 'cubic'.

Check other Rbf options in the scipy.interpolate.Rbf docs.

Schug answered 5/7, 2021 at 8:57 Comment(0)

© 2022 - 2024 — McMap. All rights reserved.