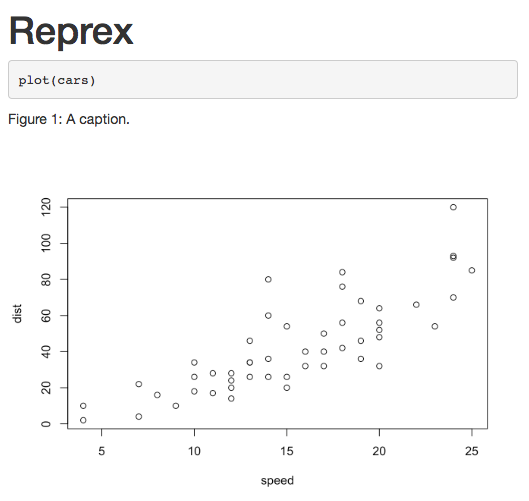
This is not a successful answer, but code output shows that the choice of a bookdown format, that would otherwise number the figure, is suppressed by inclusion of the solution proposed by Stéphane, or, as below, solution from the link suggested by dyrland.
---
title: "Untitled"
author: "Internet"
date: "29 février 2020"
output:
  bookdown::html_document2
---

```{r setup2}
#https://mcmap.net/q/1171736/-knitr-figure-captions-above
library(knitr)
knit_hooks$set(plot = function(x, options) {
  paste('<figure><figcaption>', options$fig.cap, '</figcaption><img src="',
        opts_knit$get('base.url'), paste(x, collapse = '.'),
        '"></figure>',
        sep = '')
}) #comment out to restore numbering

library(ggplot2)
```

```{r, echo = TRUE, fig.cap="Hello Dolly"}
ggplot(diamonds,aes(price,carat)) + geom_point()
```
Can a solution include both the numbering and the caption at the top?
N.B Author of the original question did mention bookdown, but did not provide a full working example to demonstrate this. Happy to edit original question if other think that would be more useful.
EDIT
Yihui has shown in his answer that there is an easy option with fig.topcaption=TRUE - Thanks! Unfortunately that caption, though it retains correct numbering, is still pushed to the bottom (in the case of plotly figures). Example below:
---
title: "Untitled"
author: "Internet"
date: "29 février 2020"
output:
  bookdown::html_document2
---

```{r setup, message=FALSE, echo=FALSE}

library(knitr)
library(ggplot2)
library(plotly)

```

Here is a ggplot object with caption at the top as desired.


```{r, fig.cap="Hello ggplot", fig.topcaption=TRUE, message=FALSE, echo=FALSE}
ggplot(diamonds,aes(price,carat)) + geom_point()
```

Here is the previous ggplot converted to a plotly object with caption reverting to the bottom.


```{r, fig.cap="Hello plotly", fig.topcaption=TRUE, message=FALSE, echo=FALSE}
my_ggplot <- ggplot(diamonds,aes(price,carat)) + geom_point()
ggplotly(my_ggplot)
```

Caption reverts to bottom even if plotly object is not created from ggplot object

```{r, fig.cap="Hello plotly2", fig.topcaption=TRUE, message=FALSE, echo=FALSE}
plot_ly(
  x=c(1,2,3),
  y=c(5,6,7),
  type='scatter',
  mode='lines')
```
EDIT 2
Plotly caption location issue solved with css here

